Virtual Earthquake Lab
advertisement
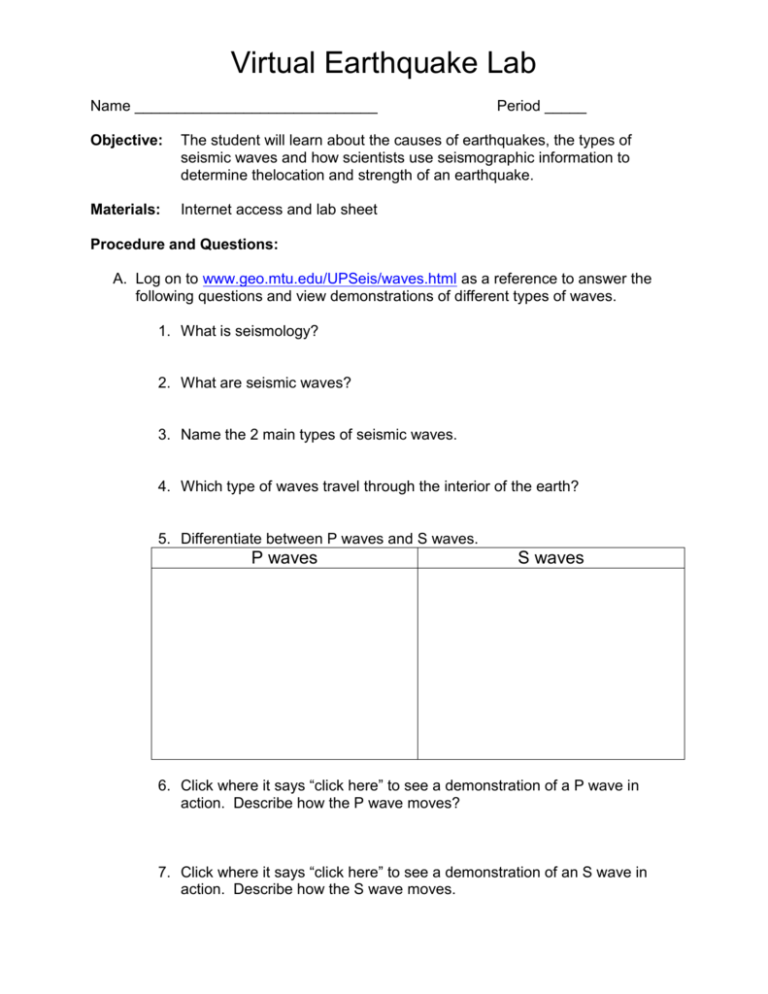
Virtual Earthquake Lab Name _____________________________ Period _____ Objective: The student will learn about the causes of earthquakes, the types of seismic waves and how scientists use seismographic information to determine thelocation and strength of an earthquake. Materials: Internet access and lab sheet Procedure and Questions: A. Log on to www.geo.mtu.edu/UPSeis/waves.html as a reference to answer the following questions and view demonstrations of different types of waves. 1. What is seismology? 2. What are seismic waves? 3. Name the 2 main types of seismic waves. 4. Which type of waves travel through the interior of the earth? 5. Differentiate between P waves and S waves. P waves S waves 6. Click where it says “click here” to see a demonstration of a P wave in action. Describe how the P wave moves? 7. Click where it says “click here” to see a demonstration of an S wave in action. Describe how the S wave moves. Below are two seismograms that show you what a P wave looks like compared to an S wave. Study the two seismograms. 8. Explain why the P waves show up first before the S waves. 9. In the seismograph below, label the P waves and the S waves. 10. Are surface waves of higher or lower frequency than body waves? 11. Where are surface waves located? 12. Which type of waves, body or surface cause most of the damage associated with earthquakes? 13. Click where is says “Click here” to see a demonstration of a Love wave in action. Describe its motion. 14. Click where it says “Click here” to see a demonstration of a Rayleigh wave in action. Describe its motion. 15. Which type of wave causes most of the shaking felt from an earthquake? B. Now, log on to www.sciencecourseware.com/VirtualEarthquake/ (you must capitalize Virtual and Earthquake) Scroll down to the bottom of the page and click on Execute Virtual Earthquake Read the information carefully and answer the following questions 16. Why do earthquakes occur? 17. Where, in general, do most earthquakes occur? 18. What do you call the point of origin of a seismic wave? 19. How are seismic waves measured? 20. How fast do P waves travel? 21. How fast do S waves travel? Choose a region for your earthquake to take place. a. San Francisco Area b. Southern California c. Japan Area d. Mexico Click Submit Choice Carefully read the information and look at the map Click View Seismograph You will be given 3 seismographs from 3 different locations because it takes 3 locations to triangulate the epicenter. Using the previous information and example, CAREFULLY and ACCURATELY calculate the time in seconds between the S and P wave for each of the 3 graphs. You will input your times under each graph. Click Convert S-P Interval. Read the section on Determining the Earthquake Distance and study the distance vs. time graph for the S and P waves. Use the S-P graph to calculate the epicentral distance in KM. The chart will tell you the times you previously calculated. For each location, find the time on the y-axis and find the distance that correlates with it to intersect the graph. Click Find Epicenter. If you have read the graphs correctly, it will tell you that you did an excellent job and will show you where the real epicenter is located. If you did NOT read the graphs correctly, it is going to say “Oops” and tell you to Re-measure. Once you get the three circles to intersect to find the epicenter, click on Compute Richter and answer the following questions: 22. What scale is used to measure the strength of an earthquake? 23. What do we mean by “magnitude” in reference to earthquakes? 24. What is the Richter magnitude of an earthquake that we can feel? 25. What is the Richter magnitude of the strongest earthquakes? 26. What 2 pieces of information do you need to figure the Richter magnitude of an earthquake? Click on Go to Next Page and read the information. 27. How much stronger is a magnitude 5 earthquake than a magnitude 3 earthquake? Click on Go to Next Page Calculate the amplitude for the maximum S wave for each graph and submit to the nomogram. Use the graph provided to estimate your Richter magnitude. You want to find the place where the lines intersect. If only 2 of the lines intersect, use that point. Enter your estimate. Click Confirm Magnitude and see how you did. It will tell you the actual Richter scale measurement of the real earthquake. After getting the magnitude correct, fill out your certificate. You should send your certificate to your e-mail and then print it from your e-mail address. You will turn in this lab paper with your certificate stapled to it.

