Yates TPS 3e Chapter 04
advertisement
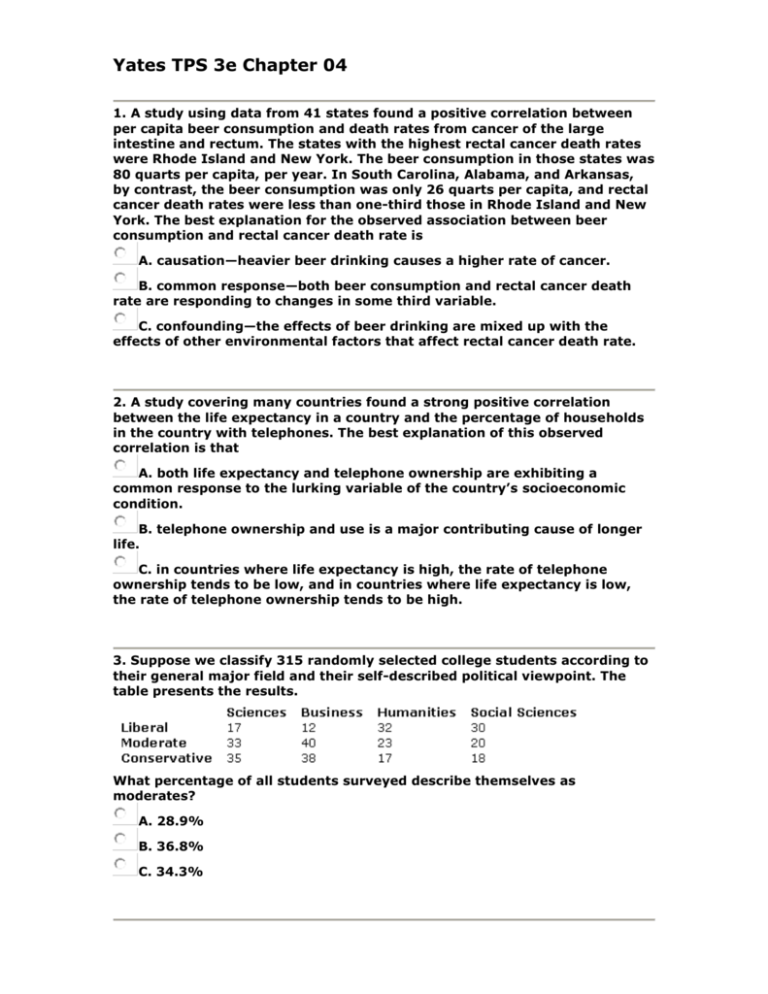
Yates TPS 3e Chapter 04 1. A study using data from 41 states found a positive correlation between per capita beer consumption and death rates from cancer of the large intestine and rectum. The states with the highest rectal cancer death rates were Rhode Island and New York. The beer consumption in those states was 80 quarts per capita, per year. In South Carolina, Alabama, and Arkansas, by contrast, the beer consumption was only 26 quarts per capita, and rectal cancer death rates were less than one-third those in Rhode Island and New York. The best explanation for the observed association between beer consumption and rectal cancer death rate is A. causation—heavier beer drinking causes a higher rate of cancer. B. common response—both beer consumption and rectal cancer death rate are responding to changes in some third variable. C. confounding—the effects of beer drinking are mixed up with the effects of other environmental factors that affect rectal cancer death rate. 2. A study covering many countries found a strong positive correlation between the life expectancy in a country and the percentage of households in the country with telephones. The best explanation of this observed correlation is that A. both life expectancy and telephone ownership are exhibiting a common response to the lurking variable of the country’s socioeconomic condition. B. telephone ownership and use is a major contributing cause of longer life. C. in countries where life expectancy is high, the rate of telephone ownership tends to be low, and in countries where life expectancy is low, the rate of telephone ownership tends to be high. 3. Suppose we classify 315 randomly selected college students according to their general major field and their self-described political viewpoint. The table presents the results. What percentage of all students surveyed describe themselves as moderates? A. 28.9% B. 36.8% C. 34.3% 4. Suppose we classify 315 randomly selected college students according to their general major field and their self-described political viewpoint. The table presents the results. What percentage of all students surveyed are conservatives majoring in business? A. 12.1% B. 42.2% C. 28.6% 5. Suppose we classify 315 randomly selected college students according to their general major field and their self-described political viewpoint. The table presents the results. What percentage of liberals surveyed were humanities majors? A. 44.4% B. 35.2% C. 28.9% 6. Suppose we classify 315 randomly selected college students according to their general major field and their self-described political viewpoint. The table presents the results. Students in which of the following major fields were most likely to identify themselves as moderates? A. social sciences B. business C. humanities 7. A business has two types of employees: managers and workers. Managers earn either $100,000 or $200,000 per year. Workers earn either $10,000 or $20,000 per year. The number of male and female managers at each salary level and the number of male and female workers at each salary level are given in the tables. We can conclude that A. the mean salary of female managers is $40,000 greater than that of male managers. B. there are more females employed by this company than males. C. the mean salary of females is greater than that of males for both managers and workers, indicating that the mean salary of female employees in general is greater than that of male employees in general. 8. Radioactive material decays over time according to a process that can be modeled by an exponential function y = abx. Suppose that you are given 100 grams of a radioactive substance and asked to observe its decay over a period of 10 days. Each day, you measure the number of grams remaining, so at the end of the study, you have a set of paired observations (x, y), where x = the number of days elapsed and y = the amount of the substance remaining on each of those days. Transforming the data, you obtain the following exponential model (rounded for simplicity’s sake): = a*b^x a = 98.25 b = .91885 Based on these results, how much material do you predict will be left after 2 weeks? A. 22 grams B. 30 grams C. 83 grams 9. One of the most important concepts in the study of radioactive decay is that of the half-life, defined as the amount of time it takes for half of a radioactive substance to decay. By measuring the levels of radioactive substances with known half-lives in dead animals, plants, and humans, archaeologists can determine how long ago a particular organism died and thereby determine its age. Recall from the previous problem that we obtained the exponential model = 98.25(.91885)x for the amount y of a radioactive substance remaining after x days, with 100 grams initially present. What is the half-life of this material? A. 7.98 days B. 1.43 days C. 62.4 days 10. Suppose that the variables x and y are related by the power function model = 16x2. If you apply base 10 logarithms to both sides to transform the model into a linear model, then the resulting linear model will have which of the following forms? A. log = log 16 + 2x B. log = 2 log 16 + 2 log x. C. log = log 16 + 2 log x. 11. It is well known that the intensity of a light source is inversely proportional to a power of the distance between the observer and the light source. In other words, the relationship between the intensity y and distance x can be modeled by a power function of the form = axb, where b is a negative number. You are asked to determine the values of a and b. You measure the intensity of a 100-watt light bulb at a distance of 1 meter from a sensing device and at 0.1-meter intervals thereafter, up to a distance of 2 meters. You obtain the following data: Based on the power function model that you obtain from these data, what is the predicted intensity of the light bulb at a distance of 4 meters? A. 0.004 B. 0.694 C. 0.018 12. Suppose that a scatterplot of log versus x shows a strongly linear relationship with a value of r close to 1. Which of the following will then occur? A. A residual plot for the original data (x, y) will display a random scattering of points. B. A scatterplot of y vs. x will resemble an exponential curve. C. The correlation between y and x will be close to 0.

