Data Envelopment Analysis
advertisement
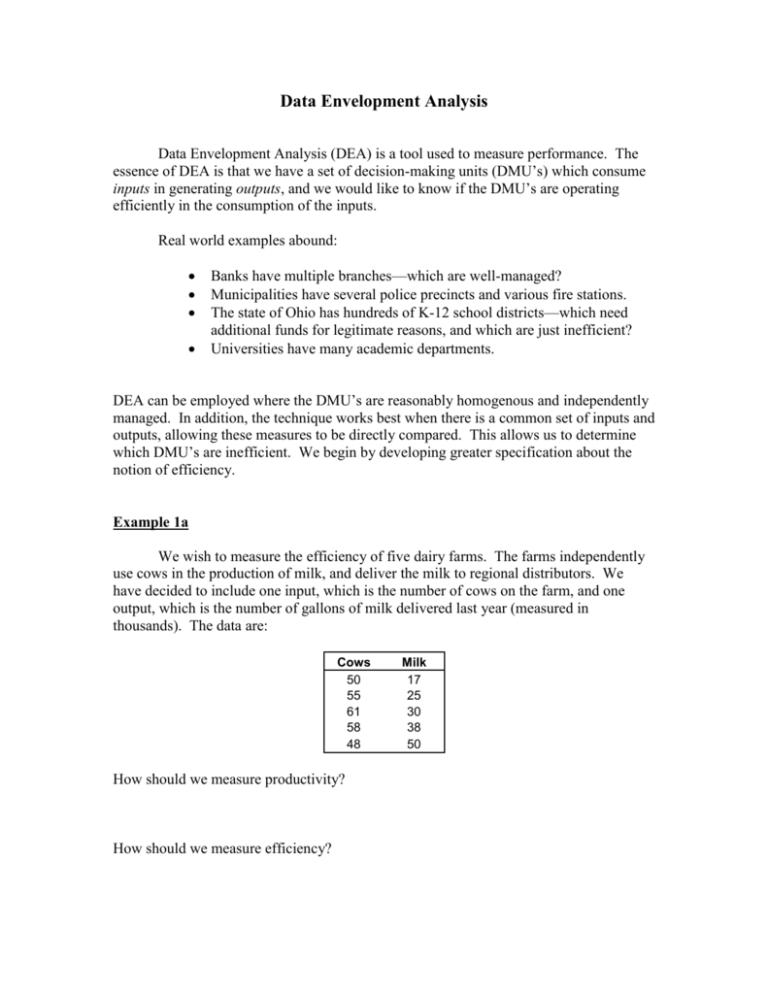
Data Envelopment Analysis Data Envelopment Analysis (DEA) is a tool used to measure performance. The essence of DEA is that we have a set of decision-making units (DMU’s) which consume inputs in generating outputs, and we would like to know if the DMU’s are operating efficiently in the consumption of the inputs. Real world examples abound: Banks have multiple branches—which are well-managed? Municipalities have several police precincts and various fire stations. The state of Ohio has hundreds of K-12 school districts—which need additional funds for legitimate reasons, and which are just inefficient? Universities have many academic departments. DEA can be employed where the DMU’s are reasonably homogenous and independently managed. In addition, the technique works best when there is a common set of inputs and outputs, allowing these measures to be directly compared. This allows us to determine which DMU’s are inefficient. We begin by developing greater specification about the notion of efficiency. Example 1a We wish to measure the efficiency of five dairy farms. The farms independently use cows in the production of milk, and deliver the milk to regional distributors. We have decided to include one input, which is the number of cows on the farm, and one output, which is the number of gallons of milk delivered last year (measured in thousands). The data are: Cows 50 55 61 58 48 How should we measure productivity? How should we measure efficiency? Milk 17 25 30 38 50 Example 1b Now assume that the farms of example 1a also produce cheese. The amount of cheese produced (hundred’s of pounds) last year is included below with our prior data set. Farm 1 2 3 4 5 Cows 50 55 61 58 48 Milk 17 25 30 38 50 Cheese 33 25 30 20 10 The factor input, cows, is now being used to produce two outputs, milk and cheese. Consider the graph in the worksheet Chart for Example 1b. Note that we are ignoring momentarily the amount of input. If all of the inputs were the same, we could claim that farms 2 and 4 were inefficient. Why? For Farm 2, the reason is obvious—Farm 3 has produced 5 more units of milk and cheese than Farm 2. So Farm 2 must be inefficient. For Farm 4, the reason is more subtle. There is no farm which produces more milk and cheese than Farm 4; in fact, Farms 1, 2 and 3 produce more cheese and less milk, while Farm 5 produces more milk but less cheese. But consider the rate of trade-off between producing milk and cheese experienced between Farms 3 and 5. Every unit of milk is traded for one unit of cheese. Farm 4 did not demonstrate that same trade-off; if it did, it would be exactly on the dotted line connecting outputs for Farms 3 and 5. Thus, the graph makes the efficient Farms obvious as long as the inputs are the same. But we do not have this situation. Reducing Example 1b to Example 1a If we had prices per unit output on milk and cheese, we could reduce the two outputs to a single measure, Y. Let yM yC uM uC = the amount of milk produced, = the amount of cheese produced, = the price of a unit of milk, = the price of a unit of cheese. Then we can compute a composite (one-dimensional) output by 2 Y u M y M uC yC Next we can proceed as in Example 1a to compute productivity and efficiency. Note that it is possible for another farm to be considered efficient if the prices change. Can Farm 4 be efficient? Example 1c—Including additional Inputs to the Model So far we have only considered the impact of one input (cows) on the output. But we could also believe that the number of acres used is an important input. We are left with the same question as before, “Can we convert the inputs to one universal measure, X?” Then we could proceed exactly as in Example 1a. Let xA xC vA vC = the number of acres used, = the number of cows used, = the price of an acre, = the price of a cow. We compute X by X vA xA vC xC A Linear Programming Model for DEA So far this does not seem to have anything to do with linear programming, but that is because we have considered a static situation. We now wish to ask, does a price structure exist so that farm 1 will be considered efficient? Let Xk and Yk be the input and output composite measures for farm k. When we choose the input and output prices, we want the efficiency for each farm to be less than or equal to one, thus: Yk Xk 1 Yk X k Yk X k 0 For the farm we are analyzing, farm 1, this means 3 Y1 1 X1 Now suppose we (arbitrarily) decide to scale our prices so that X1 = 1. When we try to find a set of prices for which farm 1 is efficient, that becomes equivalent to making Y1 as close to one as possible. For farm 1, this becomes max Y1 subject to X1 1 Yk X k 0 k 1, ,5. This linear program is shown in the spreadsheet LP—Farm 1. Notice that the weight for acres is 0. Can you see why the weight on cows is .02? The weight on milk is also 0. Why is the weight on cheese .0303? Generating the Efficiency for All Farms Using EXCEL’s index function Coupling index with Solver Sensitivity Using Shadow Prices to see which firms are better Homework: DEA Homework 1 4


