OV-1 : High Level Operational Concept Graphic
advertisement

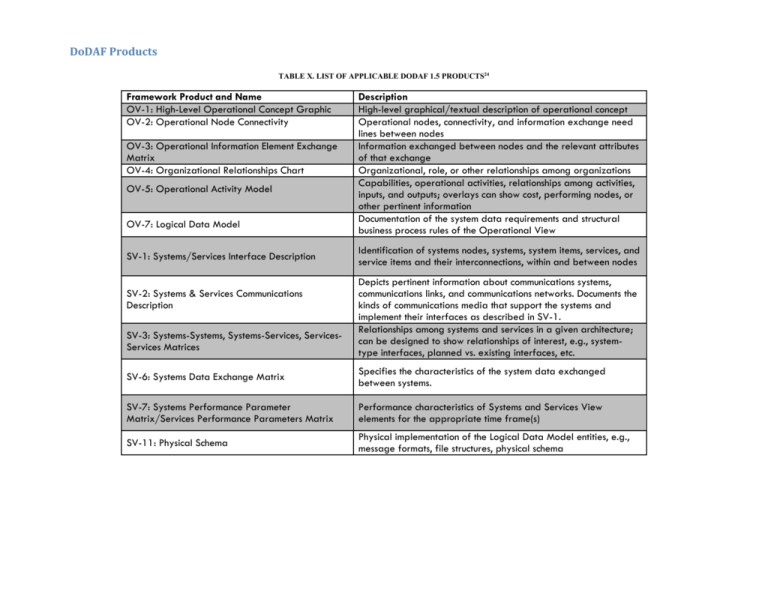
DoDAF Products TABLE X. LIST OF APPLICABLE DODAF 1.5 PRODUCTS24 Framework Product and Name OV-1: High-Level Operational Concept Graphic OV-2: Operational Node Connectivity OV-3: Operational Information Element Exchange Matrix OV-4: Organizational Relationships Chart OV-5: Operational Activity Model OV-7: Logical Data Model SV-1: Systems/Services Interface Description SV-2: Systems & Services Communications Description SV-3: Systems-Systems, Systems-Services, ServicesServices Matrices Description High-level graphical/textual description of operational concept Operational nodes, connectivity, and information exchange need lines between nodes Information exchanged between nodes and the relevant attributes of that exchange Organizational, role, or other relationships among organizations Capabilities, operational activities, relationships among activities, inputs, and outputs; overlays can show cost, performing nodes, or other pertinent information Documentation of the system data requirements and structural business process rules of the Operational View Identification of systems nodes, systems, system items, services, and service items and their interconnections, within and between nodes Depicts pertinent information about communications systems, communications links, and communications networks. Documents the kinds of communications media that support the systems and implement their interfaces as described in SV-1. Relationships among systems and services in a given architecture; can be designed to show relationships of interest, e.g., systemtype interfaces, planned vs. existing interfaces, etc. SV-6: Systems Data Exchange Matrix Specifies the characteristics of the system data exchanged between systems. SV-7: Systems Performance Parameter Matrix/Services Performance Parameters Matrix Performance characteristics of Systems and Services View elements for the appropriate time frame(s) SV-11: Physical Schema Physical implementation of the Logical Data Model entities, e.g., message formats, file structures, physical schema OV-1: High Level Operational Concept Graphic The US Power Grid is aging and needs to be transformed to a Grid that “… connects everyone to abundant, affordable, clean, efficient, and reliable electric power anytime… ”. Purpose: The proposed architecture is intended to enable the U.S. to transition from the current aging, fossil fuel-based power grid to one that meets the Nation's future needs, while providing a sufficient and secure source of clean power. FIGURE X. OV-1: HIGH LEVEL OPERATIONAL CONCEPT GRAPHIC OV-2: Operational Node Connectivity FIGURE X. OV-2: OPERATIONAL NODE CONNECTIVITY OV-3: Operational Information Element Exchange Matrix FIGURE X. OV-3: OPERATIONAL INFORMATION ELEMENT EXCHANGE MATRIX OV-4: Organizational Relationships Chart Provides power to EHV Node Are balanced by Power Lines Local Storage Stores power for Is transmitted by Is consumed by Power Generator Is generated by End User Power Is transformed by Is consumed by HV User Transformer FIGURE X. OV-4: ORGANIZATIONAL RELATIONSHIPS CHART Local Generator OV-5.1: Operational Activity Model (Provide Electric Power) FIGURE X. OV-5.1: OPERATIONAL ACTIVITY MODEL (PROVIDE ELECTRIC POWER) OV-5.2 : Operational Activity Model (1) FIGURE X. OV-5.2: OPERATIONAL ACTIVITY MODEL(1) OV-5.2: Operational Activity Model (2) FIGURE X. OV-5.2: OPERATIONAL ACTIVITY MODEL (2) OV-7: Logical Data Model FIGURE X. OV-7: LOGICAL DATA MODEL SV-1: Systems Interface Description; Services Interface Description FIGURE X. SV-1: SYSTEMS INTERFACE DESCRIPTION: SERVICES INTERFACE DESCRIPTION SV-2: Systems & Services Communications Description FIGURE X. SV-2: SYSTEMS & SERVICES COMMUNICATIONS DESCRIPTION SV-3: Systems-Systems, Systems-Services, Services-Services Matrices FIGURE X. SV-3: SYSTEMS-SYSTEMS, SYSTEMS-SERVICES, SERVICES-SERVICES MATRICES SV-6 Systems Data Exchange Matrix / Services Data Exchange Matrix FIGURE X. SV-6: SYSTEMS DATA EXCHANGE MATRIX / SERVICES DATA EXCHANGE MATRIX SV-7 Systems Performance Parameters Matrix / Services Performance Parameters Matrix System Function Balance Node Avg Response Time <0.01 Sec Max Response time <0.05 Sec FIGURE X. SV-7: SYSTEMS PERFORMANCE PARAMETERS MATRIX / SERVICES PERFORMANCE PARAMETERS MATRIX SV-11 Physical Schema – Option 1: Power source to consumer transmission FIGURE X. SV-11: PHYSICAL SCHEMA – OPTION 1: POWER SOURCE TO CONSUMER TRANSMISSION SV-11 Physical Schema – Option 2: Power geographically dispersed FIGURE X. SV-11: PHYSICAL SCHEMA – OPTION 2: POWER GEOGRAPHICALLY DISPERSED SV-11 Physical Schema – Option 3: Congestion alleviation FIGURE X. SV-11: PHYSICAL SCHEMA – OPTION 3: CONGESTION ALLEVIATION Petri Net Simulation of Physical Layout Trial 1 Trial 2 Steps to Trial 3 stability (all Trial 4 Sections>=0) Trial 5 Average 1 PowerSource 3,500 3,000 4,000 4,500 5,000 4,000 2 Geographically 5,000 4,000 5,500 4,000 4,000 4,500 3 Congestion* 5,500 6,000 5,500 5,000 5,500 5,500 Power generation and consumption distribution for physical layouts. State Alabama Alaska Arizona Arkansas California Colorado Connecticut Delaware Dist. of Col. Florida Georgia Hawaii Idaho Illinois Indiana Iowa Kansas Kentucky Louisiana Maine Maryland Massachusetts Michigan Minnesota Mississippi Missouri Montana Nebraska Nevada New Hampshire New Jersey New Mexico New York North Carolina North Dakota Ohio Oklahoma Oregon Pennsylvania Rhode Island South Carolina South Dakota Tennessee Texas Utah Vermont Virginia Washington West Virginia Wisconsin Wyoming State Code AL AK AZ AR CA CO CT DE DC FL GA HI ID IL IN IA KS KY LA ME MD MA MI MN MS MO MT NE NV NH NJ NM NY NC ND OH OK OR PA RI SC SD TN TX UT VT VA WA WV WI WY Consumption 3.44% 0.16% 2.60% 1.30% 4.87% 1.33% 0.79% 0.19% 0.00% 5.06% 3.42% 0.28% 0.26% 5.11% 3.25% 1.26% 1.33% 2.53% 1.71% 0.31% 1.25% 1.04% 2.99% 1.45% 1.17% 2.29% 0.76% 0.84% 0.75% 0.58% 1.54% 0.92% 3.68% 3.20% 0.86% 3.88% 1.73% 1.24% 5.59% 0.14% 2.58% 0.16% 2.35% 8.95% 1.08% 0.17% 1.97% 2.56% 2.30% 1.60% 1.17% Generation 3.50% 0.14% 2.69% 1.69% 4.77% 1.14% 0.71% 0.09% 0.00% 6.06% 3.69% 0.26% 0.37% 4.72% 2.84% 1.26% 1.26% 2.35% 2.45% 0.39% 1.08% 0.85% 2.62% 1.21% 1.44% 2.32% 0.61% 0.81% 0.87% 0.48% 1.51% 0.96% 3.12% 3.09% 0.78% 3.21% 2.14% 1.31% 5.16% 0.18% 2.66% 0.20% 2.06% 11.23% 0.92% 0.15% 1.75% 2.89% 1.66% 1.45% 0.90% Net Power (Gen - Con) 0.06% -0.02% 0.08% 0.39% -0.11% -0.19% -0.09% -0.10% 0.00% 1.00% 0.27% -0.03% 0.11% -0.40% -0.41% 0.00% -0.07% -0.18% 0.74% 0.07% -0.17% -0.19% -0.37% -0.24% 0.28% 0.04% -0.15% -0.03% 0.13% -0.10% -0.03% 0.04% -0.55% -0.11% -0.08% -0.66% 0.41% 0.07% -0.43% 0.04% 0.09% 0.04% -0.29% 2.28% -0.16% -0.02% -0.22% 0.33% -0.64% -0.15% -0.28% Layout1 Layout2 Layout3 6 3 5 1 15 9 8 8 7 6 14 13 11 16 16 12 5 9 8 9 11 13 5 16 14 16 4 11 10 3 10 18 17 11 5 2 10 9 18 17 12 5 4 11 8 2 8 13 15 16 5 13 1 7 20 20 18 15 16 3 12 19 12 7 17 14 19 20 20 19 12 14 10 2 8 4 19 20 5 19 21 2 19 11 2 19 20 21 6 17 9 3 19 18 2 18 12 6 24 8 21 1&2 12 31 28 28 23 24 6 19 19 14 17 27 22 31 28 31 29 13 21 20 5 18 7 30 28 8 30 25 13 30 17 3 30 31 26 11 25 15&16 9 30 28 4 27 13 10 Physical layout proposals. Layout1 - Power Source - Destination Layout2 - Geographically dispersed Section Section 1 2 3 4 5 6 7 8 9 10 11 12 13 14 15 16 17 18 Net to Grid -0.11% 0.40% 0.12% -0.03% 4.10% 0.33% 1.00% -1.13% -0.16% -1.02% -1.57% -0.46% -0.79% -0.04% -0.47% -0.06% 0 0 Index -105700 400000 120300 -34500 4095600 328700 996000 -1128100 -161000 -1017400 -1567400 -463500 -785600 -37400 -469800 -61400 0 0 1 2 3 4 5 6 7 8 9 10 11 12 13 14 15 16 17 18 19 20 21 Net to Grid Index -0.11% -105700 0.17% 170300 -0.05% -50000 0.13% 128300 0.12% 120300 -0.23% -234700 -0.26% -261100 -0.03% -30100 2.28% 2278800 0.04% 35600 0.41% 410300 -0.78% -783100 0.39% 388400 1.02% 1018100 1.00% 996000 0.33% 328700 -0.46% -463500 -0.86% -861800 -2.48% -2479400 -0.53% -532600 -0.02% -24000 Layout3 - Congestion Section 1 2 3 4 5 6 7 8 9 10 11 12 13 14 15 16 17 18 19 20 21 22 23 24 25 26 27 28 29 30 31 Net to Grid Index -0.05% -52900 -0.05% -52900 0.07% 69200 0.33% 330900 -0.15% -150300 0.11% 112900 0.13% 128300 0.12% 120300 -0.16% -162900 -0.28% -278300 0.04% 43600 -0.19% -191500 -0.47% -470000 0.00% 2600 1.14% 1139400 1.14% 1139400 0.34% 340700 -0.03% -30100 -0.81% -805500 0.04% 35600 0.67% 667300 0.74% 739200 1.00% 996000 0.33% 328700 -0.40% -396400 0.09% 85700 -0.82% -817800 -0.52% -518300 -0.37% -372400 -1.77% -1770900 -0.16% -161000


