Thinking with Mathematical Models Unit Test – Self
advertisement
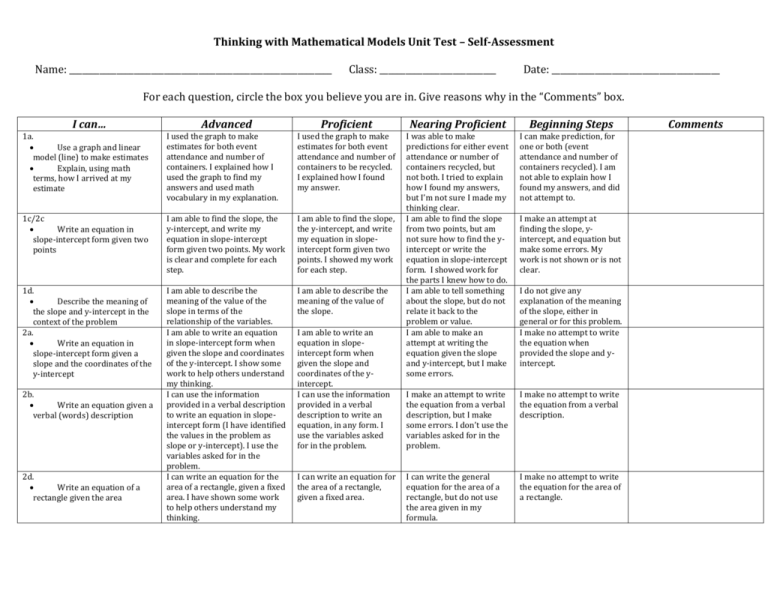
Thinking with Mathematical Models Unit Test – Self-Assessment Name: _____________________________________________________________ Class: ___________________________ Date: _______________________________________ For each question, circle the box you believe you are in. Give reasons why in the “Comments” box. Proficient Nearing Proficient Beginning Steps 1a. Use a graph and linear model (line) to make estimates Explain, using math terms, how I arrived at my estimate I can… I used the graph to make estimates for both event attendance and number of containers. I explained how I used the graph to find my answers and used math vocabulary in my explanation. I used the graph to make estimates for both event attendance and number of containers to be recycled. I explained how I found my answer. I can make prediction, for one or both (event attendance and number of containers recycled). I am not able to explain how I found my answers, and did not attempt to. 1c/2c Write an equation in slope-intercept form given two points I am able to find the slope, the y-intercept, and write my equation in slope-intercept form given two points. My work is clear and complete for each step. I am able to find the slope, the y-intercept, and write my equation in slopeintercept form given two points. I showed my work for each step. 1d. Describe the meaning of the slope and y-intercept in the context of the problem 2a. Write an equation in slope-intercept form given a slope and the coordinates of the y-intercept I am able to describe the meaning of the value of the slope in terms of the relationship of the variables. I am able to write an equation in slope-intercept form when given the slope and coordinates of the y-intercept. I show some work to help others understand my thinking. I can use the information provided in a verbal description to write an equation in slopeintercept form (I have identified the values in the problem as slope or y-intercept). I use the variables asked for in the problem. I can write an equation for the area of a rectangle, given a fixed area. I have shown some work to help others understand my thinking. I am able to describe the meaning of the value of the slope. I was able to make predictions for either event attendance or number of containers recycled, but not both. I tried to explain how I found my answers, but I’m not sure I made my thinking clear. I am able to find the slope from two points, but am not sure how to find the yintercept or write the equation in slope-intercept form. I showed work for the parts I knew how to do. I am able to tell something about the slope, but do not relate it back to the problem or value. I am able to make an attempt at writing the equation given the slope and y-intercept, but I make some errors. I make an attempt to write the equation from a verbal description, but I make some errors. I don’t use the variables asked for in the problem. I make no attempt to write the equation from a verbal description. I can write the general equation for the area of a rectangle, but do not use the area given in my formula. I make no attempt to write the equation for the area of a rectangle. 2b. Write an equation given a verbal (words) description 2d. Write an equation of a rectangle given the area Advanced I am able to write an equation in slopeintercept form when given the slope and coordinates of the yintercept. I can use the information provided in a verbal description to write an equation, in any form. I use the variables asked for in the problem. I can write an equation for the area of a rectangle, given a fixed area. I make an attempt at finding the slope, yintercept, and equation but make some errors. My work is not shown or is not clear. I do not give any explanation of the meaning of the slope, either in general or for this problem. I make no attempt to write the equation when provided the slope and yintercept. Comments I can… Advanced Proficient Nearing Proficient Beginning Steps 3a. Given a verbal description (words), complete a table of data based on an inverse variation situation I can use a verbal description to determine how to complete a table of values. I can determine how much pizza each volunteer will get based on the number of volunteers. I show some work that can be used to explain my thinking to someone. I can identify the relationship between number of volunteers and pizza per volunteer correctly. I give a description of my reasoning using strong math vocabulary. I can use a verbal description to determine how to complete a table of values. I can determine how much pizza each volunteer will get based on the number of volunteers. I can identify the relationship between number of volunteers and pizza per volunteer correctly. I give a description of my reasoning. I complete the table with random numbers rather than by following a pattern or I make no attempt to complete the table. I wrote an equation for this situation that models the relationship between number of volunteers and pizza per volunteer. I use the variables given in the problem. I provided some sort of explanation so that others can understand my thinking. I am able to determine the amount of pizza per volunteer if there are a given number of volunteers. I use the equation I wrote in 3c and show my work to explain my thinking. I wrote an equation for this situation that models the relationship between number of volunteers and pizza per volunteer. I use the variables given in the problem. I make an attempt to complete the table using a pattern, but make some errors. I am not sure what the verbal description means, but I make an attempt that follows a pattern. I can identify the relationship between number of volunteers and pizza per volunteer correctly. If I identify the wrong relationship, it matches the data I placed in the table. I give a description of my reasoning. I made an attempt to write an equation to model this situation. My equation matches my table of data if I made errors. I determine the amount of pizza per volunteer for a given number of volunteers but don’t provide any work to explain my thinking. I do not make an attempt to find the amount of pizza per volunteer for a given number of volunteers or my answer doesn’t make sense for the context. I correctly identify the graph of an inverse variation relationship but do not provide a complete explanation to show my thinking. OR I provide a complete explanation of a graph that is not inverse variation (the explanation matches that type of relationship) I do not correctly identify inverse variation or provide complete explanations to show my thinking. 3b. Identify a relationship as linear, inverse variation, or some other pattern Explain, using math vocabulary, why I chose the type of relationship I did 3c. Write an equation for a situation using a verbal description and a table of data to model the relationship 3d. Determine a missing value based on my equation or situation 4. Identify the shape of a graph of an inverse relationship Explain my reasoning for why I chose the graph I did I correctly identify the graph of an inverse variation relationship and provide an explanation (with math vocabulary) that explains my thinking completely. I am able to provide an explanation as to why the other graphs are not inverse variation. I am able to determine the amount of pizza per volunteer if there are a given number of volunteers. I use a problem solving strategy (possibly equation) and show my work to explain my thinking. I correctly identify the graph of an inverse variation relationship and provide an explanation (with math vocabulary) that explains my thinking completely. I do not identify the correct relationship between number of volunteers and pizza per volunteer or the correct relationship for my table (if my table had some errors.) I do not provide a description of my reasoning. I did not make an attempt to write an equation or my equation does not relate to anything in this problem. Comments
