Response rate
advertisement
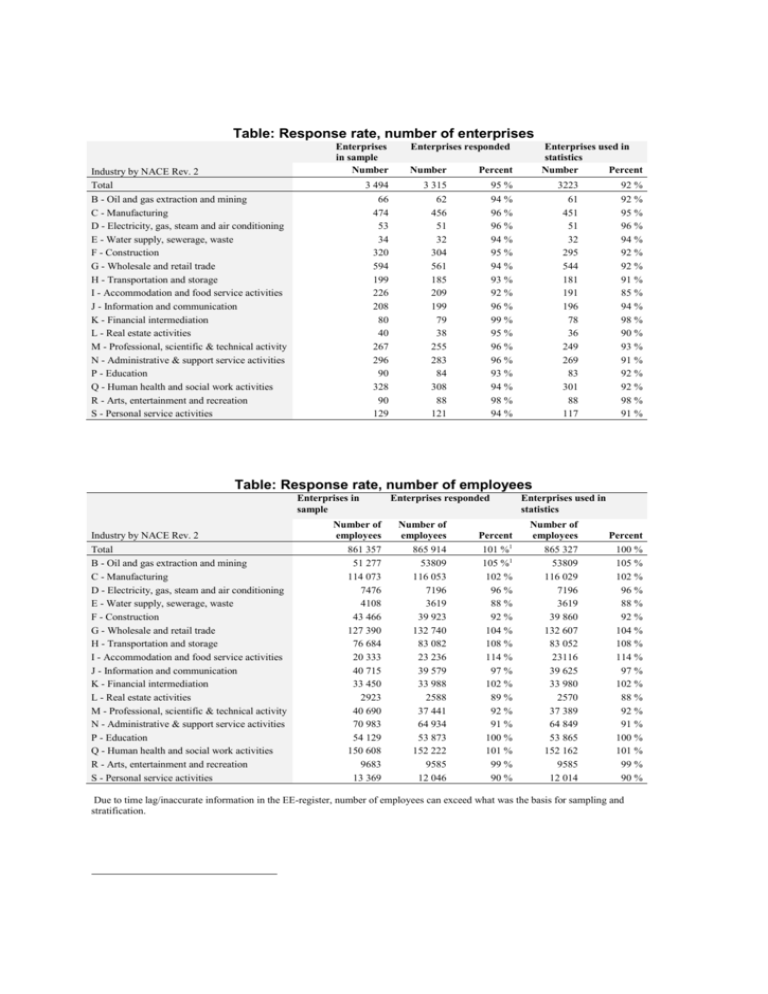
Table: Response rate, number of enterprises Industry by NACE Rev. 2 Total B - Oil and gas extraction and mining C - Manufacturing D - Electricity, gas, steam and air conditioning E - Water supply, sewerage, waste F - Construction G - Wholesale and retail trade H - Transportation and storage I - Accommodation and food service activities J - Information and communication K - Financial intermediation L - Real estate activities M - Professional, scientific & technical activity N - Administrative & support service activities P - Education Q - Human health and social work activities R - Arts, entertainment and recreation S - Personal service activities Enterprises in sample Number Enterprises responded Number Percent 3 494 66 474 53 34 320 594 199 226 208 80 40 267 296 90 328 90 129 3 315 62 456 51 32 304 561 185 209 199 79 38 255 283 84 308 88 121 95 % 94 % 96 % 96 % 94 % 95 % 94 % 93 % 92 % 96 % 99 % 95 % 96 % 96 % 93 % 94 % 98 % 94 % Enterprises used in statistics Number Percent 3223 61 451 51 32 295 544 181 191 196 78 36 249 269 83 301 88 117 92 % 92 % 95 % 96 % 94 % 92 % 92 % 91 % 85 % 94 % 98 % 90 % 93 % 91 % 92 % 92 % 98 % 91 % Table: Response rate, number of employees Enterprises in sample Industry by NACE Rev. 2 Total B - Oil and gas extraction and mining C - Manufacturing D - Electricity, gas, steam and air conditioning E - Water supply, sewerage, waste F - Construction G - Wholesale and retail trade H - Transportation and storage I - Accommodation and food service activities J - Information and communication K - Financial intermediation L - Real estate activities M - Professional, scientific & technical activity N - Administrative & support service activities P - Education Q - Human health and social work activities R - Arts, entertainment and recreation S - Personal service activities Number of employees 861 357 51 277 114 073 7476 4108 43 466 127 390 76 684 20 333 40 715 33 450 2923 40 690 70 983 54 129 150 608 9683 13 369 Enterprises responded Number of employees 865 914 53809 116 053 7196 3619 39 923 132 740 83 082 23 236 39 579 33 988 2588 37 441 64 934 53 873 152 222 9585 12 046 Percent 101 %1 105 %1 102 % 96 % 88 % 92 % 104 % 108 % 114 % 97 % 102 % 89 % 92 % 91 % 100 % 101 % 99 % 90 % Enterprises used in statistics Number of employees 865 327 53809 116 029 7196 3619 39 860 132 607 83 052 23116 39 625 33 980 2570 37 389 64 849 53 865 152 162 9585 12 014 Percent 100 % 105 % 102 % 96 % 88 % 92 % 104 % 108 % 114 % 97 % 102 % 88 % 92 % 91 % 100 % 101 % 99 % 90 % Due to time lag/inaccurate information in the EE-register, number of employees can exceed what was the basis for sampling and stratification.


