N13
advertisement
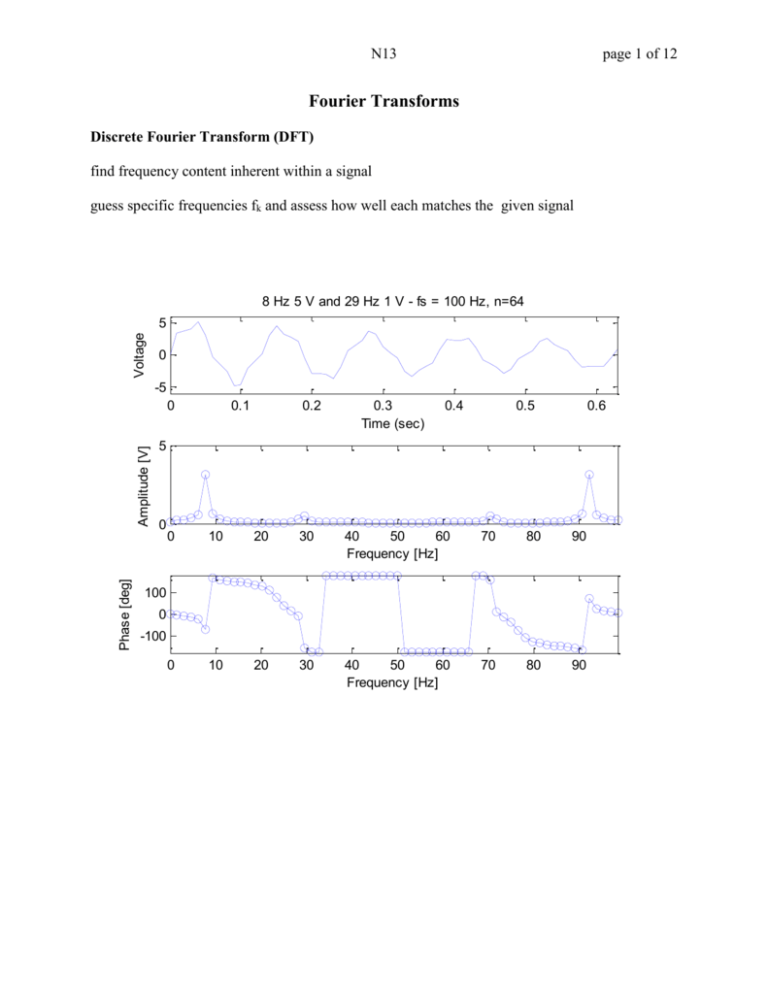
N13 page 1 of 12 Fourier Transforms Discrete Fourier Transform (DFT) find frequency content inherent within a signal guess specific frequencies fk and assess how well each matches the given signal 8 Hz 5 V and 29 Hz 1 V - fs = 100 Hz, n=64 Voltage 5 0 -5 Phase [deg] Amplitude [V] 0 0.1 0.2 0.3 Time (sec) 0.4 0.5 0.6 5 0 0 10 20 30 40 50 60 Frequency [Hz] 70 80 90 0 10 20 30 40 50 60 Frequency [Hz] 70 80 90 100 0 -100 N13 page 2 of 12 digitize xi for i = 1 to n at fixed sampling frequency fs = 1/h choose frequency fk create guess gi for i = 1 to n using frequency fk and compare to xi g sin 2 f k t t i h i / fs g i sin 2 fk i fs xi h = 10 msec +3V i -3V gi i correlation coefficient C xg 2 n xigi n i 1 correlation coefficient for sine at frequency fk f 2 n C k x i sin 2 k n i 1 fs i Ck is approximate amplitude at frequency fk inherent within digitized signal xi N13 page 3 of 12 Ck = -amplitude xi i gi i Ck = 0 xi i gi i N13 page 4 of 12 Ck = 0 xi i gi i Ck ≠ 0 xi i gi i N13 correlation coefficient 2 n xigi n i 1 C xg x Vo sin 2 f o t unknown signal at frequency fo g sin 2 f k t perfect guess sin 2 fk = fo au du 2Vo C T 2 T x g dt T 0 C convolution integral over time sample T guess page 5 of 12 C 2 T Vo sin 2 f o t sin 2 f k t dt T 0 C u 1 sin au 2 4a 2Vo T ut sin T 2 0 2 f o t dt a 2f o T t 2Vo T 1 1 1 sin 2 f o t sin 2 f o T Vo Vo sin 2 f o T T 2 8 f o 4 f o T 2 8 f o o time T for m = 1, 2, 3, … complete cycles at frequency fo C Vo Vo 1 sin 2 m 4 m T m fo C Vo for m cycles plus (or minus) some small portion 0 1 of another cycle C Vo Vo 1 1 sin 2 m Vo Vo sin 2 4 m 4 m T fo m N13 page 6 of 12 Ck = 0 xi i gi i DFT at guess fk requires correlation for both sine and cosine Ak f 2 n x i cos 2 k n i 1 fs i Bk f 2 n x i sin 2 k n i 1 fs i amp k A 2k B 2k DC fk = 0 tan k Ak = 2 mean(xi) Bk Ak Bk = 0 N13 page 7 of 12 1) single DFT at one given fk 2) multiple DFT at several discrete frequencies over band 3) complete DFT at n discrete frequencies spectral resolution f f k k f f1 < fk < f2 for k = 0 to n fs n small number of samples n causes coarse resolution in frequency domain why n discrete frequencies ? Order of Computational Complexity FLOP = floating point operation = one multiply and one add assume sine and cosine functions have been pre-computed for given number of samples n O[ ] = number of FLOPS for computation O[ Ak ] = n O[ Bk ] = n O[ single DFT ] = 2n O[ complete DFT ] = 2n(n+1) ≈ 2n2 larger sample size n provides finer spectral resolution larger sample size n increases computation time by n2 f fs n N13 Fast Fourier Transform (FFT) Cooley and Tukey (1965) radix-2 algorithm breaks n point DFT into two smaller (n/2) point DFTs compute DFT of even index points ( x2 x4 x6 … ) compute DFT of odd index points ( x1 x3 x5 … ) combine results using symmetric “butterfly” operations recursively break each (n/2) DFTs into smaller (n/4) DFTs must use n = 2P for P = integer n = …, 1024, 2048, 4096, … provides significantly faster performance over DFT O[ complete DFT ] = 2 n2 O[ FFT ] = n ln(n) n = 1024 requires 2,097,152 FLOPS n = 1024 requires 7,098 FLOPS What about 3000 data points? 1) discard samples at beginning or end and use n = 2048 2) pad extra values onto the end and use n = 4096 a) pad with zeros b) pad with last value 3) use non-radix-2 FFT (slower) page 8 of 12 N13 page 9 of 12 Practical considerations of using FFT 1) not all FFT libraries normalize by 2/n 2) most FFT libraries use complex values 3) DFT and FFT are fully reversible real = Ak imaginary = Bk N13 % try_fft.m - example use of FFT % HJSIII - 13.11.18 clear % create synthetic data % 2048 samples at 1000 Hz n = 2048; fs = 1000; % units [Hz] % 30 Hz sine, +/- 5 V f = 30; V = 5; % units [Hz] % units [volts] % optional % n=2048 and fs=1000 creates incomplete final period % spectral resolution misses 30 Hz narrow peak, FFT peaks ~ 3.5 V % cleaner phase transitions % n=2048 and fs=1024 creates integer number of periods % spectral resolution hits 30 Hz exactly, FFT peak = 5 V % noisier phase transitions %fs = 1024; % units [Hz] % time h = 1 / fs; t = [ 0:(n-1) ]' * h; % units [sec] % units [sec] % synthetic sine wave DC = 0; x = DC + V * sin( 2 * pi * f * t ); % units [volts] % optional % white noise with LP filter %x = V * randn(n,1); %x = ( x([ 2:n 1 ]) + 2*x + x([ n 1:(n-1) ]) ) / 4; % optional % square wave %x = DC + V * sign(x); % units [volts] % optional % 100 mV RMS noise noise = 0.100; %x = x + noise * randn( size(x) ); % units [volts] % units [volts] % optional % exponential decay tau = 2.0; envelope = exp( -3 * t / tau ); %x = x .* envelope; % FFT % MATLAB FFT scaled by 2/n - DC component scaled by 1/n a = fft(x) * 2 / n; % complex number - units [volts] a(1) = a(1) / 2; % units [volts] amp = abs( a ); % units [volts] phase = angle( a ) * 180 / pi; % units [deg] df = fs / n; % units [Hz] freq = [ 0:(n-1) ]' * df; % units [Hz] % show results disp( ' ' ) disp( 'FFT' ) disp( ' freq [Hz] amplitude' ) [ y,i1 ] = max(amp); i1 = i1 - 5; i2 = i1 + 10; disp( [ freq(i1:i2) amp(i1:i2) ] ) % plot time domain figure( 1 ) % units [Hz] [volts] page 10 of 12 N13 subplot( 3,1,1 ) plot( t,x ) % units [sec] [volts] axis( [ 0 t(n) -2*V 2*V ] ) xlabel( 'Time (sec)' ) ylabel( 'Voltage' ) title( [ num2str(f) ' Hz, +/- ' num2str(V) 'V, ' ... num2str(n) ' samples at ' num2str(fs) ' Hz' ] ) % plot amplitude subplot( 3,1,2 ) plot( freq,amp ) axis( [ 0 freq(n) 0 2*V ] ) xlabel( 'Frequency [Hz]' ) ylabel( 'Amplitude [V]' ) % plot phase subplot( 3,1,3 ) plot( freq,phase ) axis( [ 0 freq(n) -180 180 ] ) xlabel( 'Frequency [Hz]' ) ylabel( 'Phase [deg]' ) % units [Hz] [volts] % units [Hz] [deg] % power spectrum AND power spectral density ipwr = 0; if ipwr==1, figure( 2 ) % power spectrum = amplitude squared / 2 ps = amp .* amp / 2; % units [volts^2] % this method is the same % ps = 4 * fft(x) .* conj(fft(x)) / n / n / 2; subplot( 3,1,1 ) plot( freq, ps ) % units [Hz] [volts^2] xlabel( 'Frequency (Hz)' ) ylabel( 'FFT^2 / 2' ) disp( ' ' ) disp( 'FFT^2 / 2' ) disp( ' freq [Hz] ps' ) [ y,i1 ] = max(ps); i1 = i1 - 5; i2 = i1 + 10; disp( [ freq(i1:i2) ps(i1:i2) ] ) % units [Hz] [volts^2] % power spectral density = power spectrum / spectral bandwidth % for equally spaced spectral lines from FFT, spectral % bandwidth = df = fs/n = constant psd_fft = ps / df; % units [volts^2.sec] subplot( 3,1,2 ) plot( freq, psd_fft ) % units [Hz] [volts^2.sec] xlabel( 'Frequency [Hz]' ) ylabel( 'FFT^2 / 2 / df' ) disp( ' ' ) disp( 'FFT^2 / 2 / df' ) disp( ' freq [Hz] psd_fft' ) [ y,i1 ] = max(psd_fft); i1 = i1 - 5; i2 = i1 + 10; disp( [ freq(i1:i2) psd_fft(i1:i2) ] ) % MATLAB PSD function % [Pxx,F] = PSD(X,NFFT,Fs,WINDOW,NOVERLAP) nfft = 256; [ px,fx ] = psd( x, nfft, fs, nfft, 0 ); subplot( 3,1,3 ) plot( fx, px ) xlabel( 'Frequency [Hz]' ) % units [Hz] [volts^2.sec] page 11 of 12 N13 ylabel( 'MATLAB PSD output' ) disp( ' ' ) disp( 'MATLAB PSD output' ) disp( ' freq [Hz] psd' ) [ y,i1 ] = max(px); i1 = i1 - 5; i2 = i1 + 10; disp( [ fx(i1:i2) px(i1:i2) ] ) % bottom of iwpr segment end page 12 of 12

![Y = fft(X,[],dim)](http://s2.studylib.net/store/data/005622160_1-94f855ed1d4c2b37a06b2fec2180cc58-300x300.png)
