Spreadsheet Vocabulary
advertisement
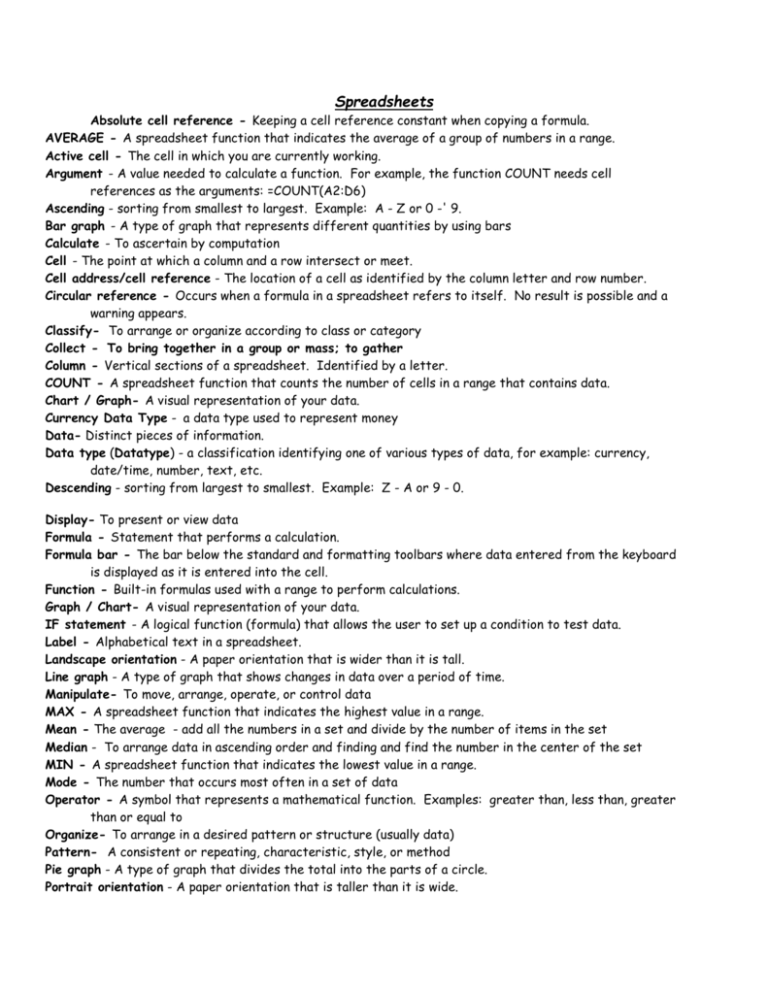
Spreadsheets Absolute cell reference - Keeping a cell reference constant when copying a formula. AVERAGE - A spreadsheet function that indicates the average of a group of numbers in a range. Active cell - The cell in which you are currently working. Argument - A value needed to calculate a function. For example, the function COUNT needs cell references as the arguments: =COUNT(A2:D6) Ascending - sorting from smallest to largest. Example: A - Z or 0 -' 9. Bar graph - A type of graph that represents different quantities by using bars Calculate - To ascertain by computation Cell - The point at which a column and a row intersect or meet. Cell address/cell reference - The location of a cell as identified by the column letter and row number. Circular reference - Occurs when a formula in a spreadsheet refers to itself. No result is possible and a warning appears. Classify- To arrange or organize according to class or category Collect - To bring together in a group or mass; to gather Column - Vertical sections of a spreadsheet. Identified by a letter. COUNT - A spreadsheet function that counts the number of cells in a range that contains data. Chart / Graph- A visual representation of your data. Currency Data Type - a data type used to represent money Data- Distinct pieces of information. Data type (Datatype) - a classification identifying one of various types of data, for example: currency, date/time, number, text, etc. Descending - sorting from largest to smallest. Example: Z - A or 9 - 0. Display- To present or view data Formula - Statement that performs a calculation. Formula bar - The bar below the standard and formatting toolbars where data entered from the keyboard is displayed as it is entered into the cell. Function - Built-in formulas used with a range to perform calculations. Graph / Chart- A visual representation of your data. IF statement - A logical function (formula) that allows the user to set up a condition to test data. Label - Alphabetical text in a spreadsheet. Landscape orientation - A paper orientation that is wider than it is tall. Line graph - A type of graph that shows changes in data over a period of time. Manipulate- To move, arrange, operate, or control data MAX - A spreadsheet function that indicates the highest value in a range. Mean - The average - add all the numbers in a set and divide by the number of items in the set Median - To arrange data in ascending order and finding and find the number in the center of the set MIN - A spreadsheet function that indicates the lowest value in a range. Mode - The number that occurs most often in a set of data Operator - A symbol that represents a mathematical function. Examples: greater than, less than, greater than or equal to Organize- To arrange in a desired pattern or structure (usually data) Pattern- A consistent or repeating, characteristic, style, or method Pie graph - A type of graph that divides the total into the parts of a circle. Portrait orientation - A paper orientation that is taller than it is wide. Predict- To state, tell about, or make know in advance of the actual occurrence of the event Range - A group of cells closely related. Relative cell reference - Adjusts the cell references in a formula while retaining the mathematical processes. Row - Horizontal sections of a spreadsheet. Identified by a number. Spreadsheet - A row and column arrangement of data used to enter, calculate, manipulate, and analyze numbers. They are used to prepare budgets, financial statements, and inventory management. They are also used to make forecasts. Sort - To arrange data information in a specific order SUM - A function used to add numbers in a range. Value - A number entered on a spreadsheet. What-if analysis - A spreadsheet tool used to play out different situations to determine outcome. Workbook - Two or more worksheets.

