Mopani
advertisement
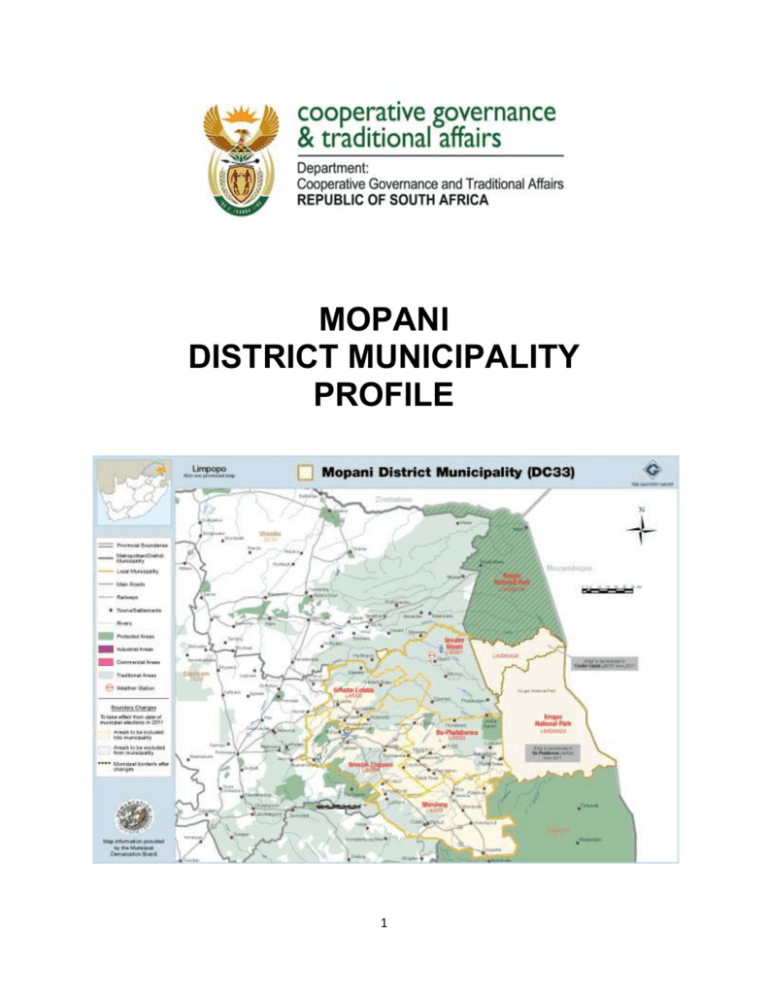
MOPANI DISTRICT MUNICIPALITY PROFILE 1 TABLE OF CONTENTS 1. 1.1 1.2 1.3 1.4 2. 2.1 2.2 2.3 2.4 2.5 2.6 3. 4. 4.1 4.1.1 4.1.2 4.1.3 5. 6. 7. EXECUTIVE SUMMARY INTRODUCTION Overview Municipalities within the District Political and Administrative Leadership and Seat of District Political Representation SERVICE DELIVERY Household Infrastructure Sanitation Water Electricity Refuse Removal Service Provider AUDIT OPINIONS STATE OF LOCAL GOVERNMENT ASSESSMENT Overview of findings on assessment in the Municipality Governance Financial Management and Viability Service Delivery INFRASTRUCTURE PRIORITIES IN TERMS OF THE MUNICIPAL TURN-AROUND STRATEGY MIG PROJECTS VULNERABILITY CLASSIFICATION 2 3 4 4 5 5 6 8 8 8 8 9 9 9 9 10 10 10 10 10 11 11 14 EXECUTIVE SUMMARY Mopani District Municipality has low levels of urbanisation. Other than Ba-Phalaborwa Municipality where nearly 66% of the population can be classified as urbanised, the level in the other municipalities is below 15%. The mining sector contributes 30% to the GDP, Agriculture is the most important economic sector in Greater Tzaneen, Greater Giyani, Maruleng and Greater Letaba. There are five local municipalities within the district. The steadily growing population places an additional strain on current resources. Formal employment is scarce and unemployment and poverty levels remain very high. More than 50% of the adult population is functionally illiterate. The low education levels and concomitant lack of skills needed in the formal labour market further compound the problem. The towns and their extensions have well-developed water services while most rural villages do not. The majority of settlements are in the rural areas where the lack of water services it’s the delivery of sanitation. The dispersed nature of the settlements makes provision difficult and the majority of dwellings use pit latrines or simply have no sanitation facilities at all. An overview of household access to infrastructure in the district shows an improvement from a lower level of 40% in 1996 to a higher level of 53% in 2009. The main contributor to the increase in access is electricity infrastructure. From 2005/6 to 2006/7 Mopani district municipality and all the local municipalities within its jurisdiction did not register any improvement in audit outcomes. Letaba local municipality was the only municipality to achieve financially unqualified with findings audit results in 2008/9 and 2009/10. The State of Local Government Assessment found that in the Mopani District there is a contestation of powers and functions between the District and some of its local municipalities. The Greater Tzaneen and Ba-Phalaborwa municipalities applied for the water service authority functions, and are of the view that the district is prolonging timeframes for service delivery. The District is of the view that the powers allocated to them did not allow for interventions in local municipalities. The Mopani District municipality is still having a serious challenge with the waste management function. In terms of its Municipal Turn-Around Strategy the District identified access to water and sanitation as still a huge priority in this District. Three of the five local municipalities in the Mopani District have been classified as in the category of most vulnerable by DCoG in terms of functionality, socio-economic profile and backlog status. This profile confirms that infrastructure prioritisation in Mopani District should focus on access to clean water and sanitation. 3 1. INTRODUCTION 1.1 Overview1 The Mopani District Municipality (MDM) is located in a region where there are spectacular natural resources, including forests, bushveld, sweeping plains and wild life. The district was named due to the abundance of the nutritional Mopani worm in the area. Mopani District Municipality comprises five local municipalities: Ba-Phalaborwa, Greater Giyani, Greater Tzaneen, Maruleng and Greater Letaba. Maruleng was incorporated as a result of demarcation changes instituted in March 2006. The three major towns in the district are Tzaneen, Phalaborwa and Modjadjiskloof. Other substantial towns are Giyani, Nkowankowa, Lulekani, Ga-Kgapane, Lenyenye, Gravelotte, Hoedspruit and Namakgale. Levels of urbanization are low. Other than BaPhalaborwa Municipality where nearly 66% of the population can be classified as urbanised, the level in the other municipalities is below 15%. The mining sector contributes 30% to the GDP, followed by the general government services sector (17%) and finance and business services (15%). Retail is an important secondary economic sector, especially in the Giyani area which serves a large rural area. There is currently a lack of wholesalers in the municipality which results in shop owners having to travel to Tzaneen, Polokwane and even Johannesburg to obtain stock. Agriculture is the most important economic sector in Greater Tzaneen, Greater Giyani, Maruleng and Greater Letaba. In addition to citrus fruits, sub-tropical fruit, including mangoes, avocadoes and bananas are grown. Mining is the most important sector in Ba-Phalaborwa. Copper is mined and further processing of by-products and phosphates is undertaken. There are ample opportunities for small-scale mining of vermiculite, onite, gold and emeralds. Land ownership in the district is a contentious problem. There are 349 land claims in the district, representing 26.85% of the total land area. Restitution and redistribution could lead to improved living standards or result in large-scale sterilisation of productive land in agricultural, mining and conservation areas. The unresolved claims are preventing exploitation of land for productive agricultural activities and agro-processing. This poses a serious economic threat in a district heavily reliant on agriculture. The unsettled claims impact on service delivery by municipalities as, for example, they hinder the identification and formalisation of land for refuse sites and township establishment. Source: Gaffney’s, November 2009: Local Government in South Africa 2009 – 2011, Official Yearbook: p 931 - 933 1 4 The steadily growing population places an additional strain on current resources. Provision of good primary health care, social welfare and education becomes more complex as resources are strained. Formal employment is scarce and unemployment and poverty levels remain very high. More than 50% of the adult population is functionally illiterate. The low education levels and concomitant lack of skills needed in the formal labour market further compound the problem. The towns and their extensions have well-developed water services while most rural villages do not. The majority of settlements are in the rural areas where the lack of water services it’s the delivery of sanitation. The dispersed nature of the settlements makes provision difficult and the majority of dwellings use pit latrines or simply have no sanitation facilities at all. Many people are not properly housed and, in general, the quality of housing is poor. People live in informal housing and in traditional dwellings. Town planning is nonexistent in the informal settlements and has resulted in communities sometimes settling in flood plain areas. Energy distribution in the district is an issue of great concern. Local municipalities provide Eskom electricity to urban areas and towns. Rural areas, however, are not provided for and villagers continue to use unsafe paraffin lamps and candles. A major concern to the district is the absence of street lights on major streets in urban areas such as Giyani, which results in dangerous driving conditions and safety concerns for pedestrians. Street lighting is absent in most rural areas. Municipalities undertake refuse removal in urban areas and towns. There are five waste disposal sites in the district municipality which serve the urban areas. The Tzaneen waste disposal site is the only one that has a permit to operate and is well managed. In rural areas there is no refuse removal. Residents’ disposal sites are unprotected. There are insufficient hospitals, health centres, clinics and mobile clinics available to serve the needs of the whole population, especially those residing in remote rural areas. Health services provision is further hindered by the extremely scattered nature of the many small settlements. The lack of qualified personnel remains a problem. HIV/AIDS, malaria and tuberculosis continue to be major challenges to the health sector. 1.2 Municipalities within the Mopani District The details of the five local municipalities within the District is tabled below: Table 1: Statistics of the Mopani District and Local Municipalities Municipalities within the District Mopani District Municipality Area (km²) in 2009 24,486.25 Area (km²) after 2011 Local Govt Elections & % change 20,010.94 5 -18 28% Population No. of Households 1,061,815 263,862 Poverty Rate 57.50% Da-Phalahorwa Local Municipality 3,004.38 7,461.57 148.36% 126,504 33,578 45.73% Greater Giyani Local Municipality 2,985.12 4,171.61 39.75% 246,102 57,175 68.46% Greater Letaba Local Municipality 1,890.69 1,890.89 - 246,181 59,163 Greater Tzaneen Local Municipality 3,242.57 3,242.57 - 346,878 89,265 Maruleng Local Municipality 3,244.30 3,244.30 - 95,165 24,435 Mopani District Management Area (Kruger National Park) 1.3 48.68% 60.73% 63.84% To be incorporated into 10,119.00 the local municipalities 986 246 57.50% Political and Administrative Leadership and Seat of District Political Leadership: Executive Mayor: Mr L J Matlou Administrative Leadership: Municipal Manager: Mr M T Maake The head office of the District is located in Giyani. 1.4 Political representation2 Table 2: Local Government Election 2006 / Provincial and National Elections 2009 comparison: Leading Parties in the Elections 1st 2nd 3rd 4th Local Government Elections 2006 Party Party Votes and Ward Votes and % % ANC DA ACDP PAC Other Totals 2 173,479 9,529 5,310 4,048 13,370 205,736 84.3% 4.6% 2,6% 2.0% 6.5% 100% 170,858 9,503 4,567 4,492 16,828 206,248 82.8% 4.6% 2.2% 2.2% 8.2% 100% Councillor Seats Party Seats % ANC DA ACDP PAC Other Totals 39 2 1 1 1 44 88.6% 4.5% 2,3% 2.3% 2.3% 100% Provincial Elections 2009 Party Votes and % National Elections 2009 Party Votes and % ANC COPE DA ACDP Other ANC COPE DA ACDP Other 288,632 21,237 10,250 3,027 7,755 330,901 87.2% 6.4% 3.1% 0.9% 2.3% 100% 298,212 20,948 11,193 2,804 7,166 340,323 UPDATE Aug'09: DC40 seats – ANC (83%) 15 seats, ACDP (6%,) 1 seal, DA(6%) 1 seat, PAC(5%) 1 seat, Total 18 0040 seats 6 87.6% 6.2% 3.3% 0.8% 2.1% 100% Figure 1: 2011 Local Government Election results and seat allocation: The ANC is the leading party in terms of proportional DC40 Seats in Mopani, with 17 out of 20 seats. 7 2. SERVICE DELIVERY3 2.1 Mopani District Municipality Household Infrastructure Household Infrastructure Overview LIM - DC33 Mopani District Municipality 0.80 0.70 0.60 0.50 Index 0.40 0.30 0.20 LIM - DC33 Mopani… 0.10 0.00 1996 1997 1998 1999 2000 2001 2002 2003 2004 2005 2006 2007 2008 2009 Source: IHS Global Insight Regional eXplorer version 574 Mopani has got the third highest access to infrastructure amongst other districts in the province. An overview of household access to infrastructure in the district shows an improvement from a lower level of 40% in 1996 to a higher level of 53% in 2009. Main contributor to the increase in access is electricity infrastructure. 2.2 Sanitation With regard to access to sanitation, the district municipality’s household access to hygienic toilets has gone up from 21% in 1996 to 35% in 2009. The improvement in access to sanitation in general in the Municipality is mainly due to the increase in the use of pit latrines which was at 45% by 2009. 2.3 Water Access to piped water above RDP level increased in the district remained the same over the years at 62%. Similarly, there has not been an increase as well in access to piped water below RDP level. 3 Sources: HIS Global Insight Regional eXplorer version 574 and Municipal Demarcation Board, 2008: National Report on Local Government Capacity, District and Local Municipalities, MDB Capacity Assessment, 2007/2008. 8 2.4 Electricity The increase in electricity connections is the biggest infrastructure achievement in the municipality. In 1996, household access to electricity connections was below 50%. Access has, however, increased over the years reaching 78% by 2009. 2.5 Refuse removal There has been a slight increase in access to formal refuse removal service from 1996 to 2009 in the Municipality. Access has gone up from 11% in 1996 to 13% in 2009. Personal refuse removal also went up slightly over the years reaching 65% in 2009. The district is rural and the low levels of formal refuse removal must be taken in the context of low settlement densities, where on-site disposal or backyard burning of waste is sometimes appropriate. 2.6 Service provider Mopani district does not perform the electricity reticulation. The district does have authority and is performing potable water and sanitation. However, it does not perform refuse removal, refuse dumps and solid waste disposal functions. 3. AUDIT OPINIONS Table 3: Audit Opinions of the District and Local Municipalities Municipality Audit Opinion 2005/6 Disclaimer Audit Opinion 2006/7 Disclaimer Audit Opinion 2007/8 Disclaimer Audit Opinion 2008/9 Financially unqualified with findings BaPhalaborwa LM Giyani LM Letaba LM Audit outstanding Audit outstanding Adverse Disclaimer Disclaimer Audit outstanding Disclaimer Audit outstanding Qualified Qualified Tzaneen LM Maruleng LM Disclaimer Disclaimer Disclaimer Disclaimer Qualified Disclaimer Qualified Financially unqualified with findings Qualified Qualified Mopani DM Audit Opinion 2009/10 Audit not finalised at legislated date Disclaimer Qualified Financially unqualified with findings Qualified Financially unqualified with findings Source: Auditor-General 2009 and 2011, see www.agsa.co.za From 2005/6 to 2006/7 Mopani district municipality and all the local municipalities within its jurisdiction did not register any improvement in audit outcomes. Letaba local 9 municipality was the only municipality to achieve financially unqualified with findings audit results in 2008/9 and 2009/10. 4. STATE OF LOCAL GOVERNMENT ASSESSMENT 4.1 Overview of findings on assessment in the municipality 4.1.1 Governance The State of Local Government Assessment of 2009 identified a number of governance issues in Limpopo including that oversight roles and management of council secretariat needs improvement and that there is limited input on council items by traditional leaders. On public participation it was found that there are low levels of participation due to vastness of wards areas and lack of clear understanding of issues. The functionality of Ward Committees and the role and accountability of CDWs to local municipalities remain a challenge. 4.1.2 Financial Management and Viability The following were common emerging issues in terms of financial management and viability listed in the Provincial Report on Limpopo: poor revenue collection, grant dependency within municipalities, limited allocations for maintenance and operations budget, recurring audit queries which were not rectified over the years, the billing system with an unreliable data resulting in poor debt collection compounded by the high Indigent rates. In the Mopani District a district wide shared Audit Committee was established, but a number of local municipalities indicated that the arrangement was not adding sufficient value as to the depth of audit reports on local matters. The Mopani District received disclaimers for the 2007 and 2008 financial years. 4.1.3 Service Delivery Service delivery issues raised in the Provincial Report includes poor planning capacity, aging infrastructure, land claims, and slow progress with achievement of MDGs. In the Mopani District there is a contestation of powers and functions between the District and some of its local municipalities. The Greater Tzaneen and Ba-Phalaborwa municipalities applied for the water service authority functions, and are of the view that the district is prolonging timeframes for service delivery. The District is of the view that the powers allocated to them did not allow for interventions in local municipalities. The Mopani District municipality is still having a serious challenge with the waste management function. Only the Greater Tzaneen local municipality has authorized waste management facility and landfill sites. 10 The role of Traditional leaders in land allocation and upgrading of land tenure rights also need to be resolved. In some cases such as Greater Giyani many traditional leaders allocate land to communities without consultation with municipalities. 5. INFRASTRUCTURE PRIORITIES OF THE MUNICIPAL TURN-AROUND STRATEGY The Mopani District Municipality identified a number of priorities for basic service delivery in the Mopani Municipal Turn-Around Strategy. Access to water and sanitation is still a huge priority in this District. Table 4: Infrastructure delivery in terms of the MTAS Access to water Challenges 198 323 hh with access to water Implement and upgrade water schemes Municipal Actions Other support and interventions 6. Engage DWA, Cogta and Lepelle Northern Water Access to sanitation 194 830 hh access sanitation To supply a total hh of 10 000 with VIP latrines by Dec 2010 Engage DWA and Cogta for sanitation funding arrangements Access to Electricity 239 085 To supply a total hh of 7619 with electricity Engage Eskom and DE MIG Table 5: MIG projects Municipality Project name Mopani DM Namakgale Sewage Works Phalaborwa Upgrading of Sewage System Boyelang Water Supply Giyani System N ( Mapuve ) Water Reticulation GGM Extension of Middle Letaba Sekgosese Ground Water Development Scheme Registered MIG funds Total actual expenditure in the 2010/11 financial year on MIG funds Project status (Registered/desi gn/tender/constr uction) Project category (e.g. water, sanitation, PMU) R 0.00 Construction Sanitation R 6,071,885.00 R 1,965,810.00 Design & Tender Sanitation R 5,534,400.00 R 0.00 completed Water R 47,264,001.92 R 31,653,736.23 Construction Water R 25,764,000.00 R 2,003,923.35 Construction Water R 17,514,141.00 R 10,585,922.03 Completed Water R 39,535,575.00 R2,204,623.20 Construction Water 11 Upgrading of Water Reticulation GLM Modjadji Outfall Sewer Modjadji Sewer Reticulation Extension of Modjadji Water Works Upgrading of Kgapane WTP Upgrading of senwamokgope Sewage plant Thapane RWS Lenyenye Sewage Works Tours Bulk Water Scheme Mametja Sekororo RWS Hoedsspruit Bulk Water Supply Kampersus Bulk Water Supply Mopani Rural Household Sanitation PMU management Mopani DM BaPhalaborwa LM Gravelotte RDP streets phase 1 Qugga culverts and storm water control phase 2 Tipeng Stomwater Control Culverts phase 2 Lulekani OR street tarring phase3 Namakgale phase 3 Upgrading of streets Namakgale phase 4 Upgrading of streets PHB Taxi Rank CBD Streets, Pick-up and Drop Points Gravelotte RDP streets paving phase 2 Kurhula streets paving phase 1 Makhushane/Pata R 32,639,051.00 R 0.00 Construction Water R 16,333,375.00 R 389,815.25 Construction Water R 39,384,886.00 R 1,012,207.73 Construction Water R 17,649,800.00 R 1,356,144.66 Completed Water R 56,000,000.00 R 9,134,157.76 Completed Water R 13,974,428.00 R 44,794,909.00 R 4,248,886.92 R 0.00 Design & Tender Design & Tender Sanitation Water R 13,154,475.00 R 16,405,713.95 Construction Water R 13,789,887.00 R 8,810,492.33 Construction Water R 55,224,240.00 R 3,392,687.63 Construction Water R 59,019,988.80 R 0.00 Design & Tender Water R 27,659,428.00 R 7,234,748.39 Construction Water R173,998,800.00 R 43,334,254.86 completed Sanitation No status PMU R 1,500,000.00 R 0.00 Completed Stormwater R 3,000,000.00 R 164,280.13 Completed Stormwater R 1,500,000.00 R 134,965.09 Completed Stormwater R 3,000,000.00 R 0.00 Completed Roads & s/water R 3,000,000.00 R 2,692,663.40 Completed Roads & s/water R 6,000,000.00 R 707,918.01 Construction Roads & s/water R 3,000,000.00 R 2,778,950.58 Construction Roads & s/water R 3,000,000.00 R 2,580,290.17 Completed Roads & s/water R 5,000,000.00 R 3,000,000.00 R 296,650.14 R 2,629,937.66 Design & Tender Construction Roads & s/water Roads & s/water 12 medi streets paving phase 1 Majeje Subsoil Drainage Systems Thepe Trust Bridge PMU Management Fees BaPhalaborwa LM R 3,000,000.00 R 506,397.69 Design & Tender Stormwater R 3,000,000.00 R 1,522,913.97 Construction Stormwater Function PMU completed Roads & s/water completed Roads & s/water R 675,000.00 Giyani LM Tzaneen LM Kheto Bridge Mashavela regravelling and stormwater Mninginisi B3 regravelling and stormwater Giyani Section F Upgrading of Gravel to Tar Phase II Giyani Section A road Phase II Muyexe sport facility Kremetart and Siyandhani Highmast Construction of Giyani section E Road Upgrading of Shikhumba Access Road Giyani Tourism Information Centre Regravelling of Khashane and Kheyi Road PMU management Greater Giyani LM Hweetji Access Road Makhefora Access Road Tzaneen Rural Waste Removal Sasekani Access Road Ramotshinyadi Internal Street Ramotshinyadi to Mokgwathi tar road PMU management R15,341,310.00 R3,701,243.78 R5,250,000.00 R- R6,000,000.00 R1,162,068.08 completed Roads & s/water R6,090,000.00 R11,327,456.99 Construction Roads & s/water R3,800,000.00 R447,612.28 Design & Tender Roads & s/water R5,000,000.00 R3,949,071.99 Construction R550,000.00 R414,327.17 Construction Sports facilities Street / Community Lighting R12,090,000.00 R - Registered Roads & s/water R5,000,000.00 R625,441.11 Design & Tender Roads & s/water R11,500,000.00 R2,482,685.48 Construction Tourism R3,500,000.00 R507,756.23 Design & Tender Roads & s/water R986,000.16 R 1,160,204.00 No status PMU R4,427,200.00 R2,477,510.77 Completed Roads & s/water R4,037,200.00 R1,758,671.57 Completed R53,286,243.00 R 25,312,090.36 Completed Roads & s/water solid waste disposal site R2,371,200.00 R 1,272,809.70 Design & Tender Roads & s/water R25,092,540.00 R 2,918,206.25 Construction Roads & s/water R38,750,000.00 R2,884,084.98 Design & Tender Roads & s/water R1,941,950.00 R1,690,528.79 No status PMU 13 Tzaneen LM Hoedspruit Stormwater Management Madeira Access Road Ga Fannie to Turkey Access Road Maruleng Indoor Sports Mahlomelong Surfacing of Main Access Road Hlohlokwe Low Level Bridges Willows Sports Field Rakgolokoane to Enable Access Road PMU Management fee Maruleng LM Source: All MIG projects, 2011 June Maruleng LM R 2,953,520.00 R 2,781,553.00 Construction Roads & s/water R3255000 R 3,210,957.28 Construction Roads & s/water R 5,580,000.00 R 2,192,832.65 Construction Roads & s/water R 14,420,082.00 R 0.00 Registered Sports facilities R 6,850,000.00 R 1,582,316.19 Construction Roads & s/water R 2,000,000.00 R 2,000,000.00 Construction Roads & s/water R 5,780,000.00 R 0.00 Construction Sports facilities R 16,500,000.00 R 2,013,833.93 Design & Tender Roads & s/water R994309.92 R 994,309.92 No status PMU As stated in the 2011 monthly non-financial report on MIG, Mopani district, BaPhalaborwa, Giyani, Tzaneen and Maruleng submitted their June 2011 MIG reports. However, these reports do not have the signature of the accounting officer as required. Mopani district, Giyani, Tzaneen and Maruleng did not report the status of Project Management Units in their reports. In Ba-Phalaborwa, Giyani, Tzaneen and Maruleng most projects are about roads and water. Ba-Phalaborwa has completed six of its 13 projects. In Giyani only three of its 12 projects have been completed. Tzaneen has managed to complete three of its seven projects. In Maruleng most projects are at a construction phase. 7. VULNERABILITY CLASSIFICATION The DCoG Municipal Spatial Classification System was designed to develop municipal profiles according to spatial location, based upon results from indicator sets on functionality, socio-economic profile and backlog status. Its purpose is to inform a differentiated approach to municipalities. The four municipal classifications developed by DCoG are: Class 1: Most vulnerable (57 local municipalities) Class 2: Second most vulnerable (58 local municipalities) Class 3: Second highest performing (58 local municipalities) Class 4: Highest performing (58 local municipalities) The five local municipalities in the Mopani District can be classified as follow: 14 Table 6: Vulnerability Classification Local Municipality Ba-Phalaborwa Greater Giyani Greater Letaba Greater Tzaneen Maruleng Classification Second highest performing Most vulnerable Most vulnerable Second most vulnerable Most vulnerable From this table it is evident that three of the five local municipalities in the Mopani District fall into the most vulnerable category. 15
