S2 Table
advertisement
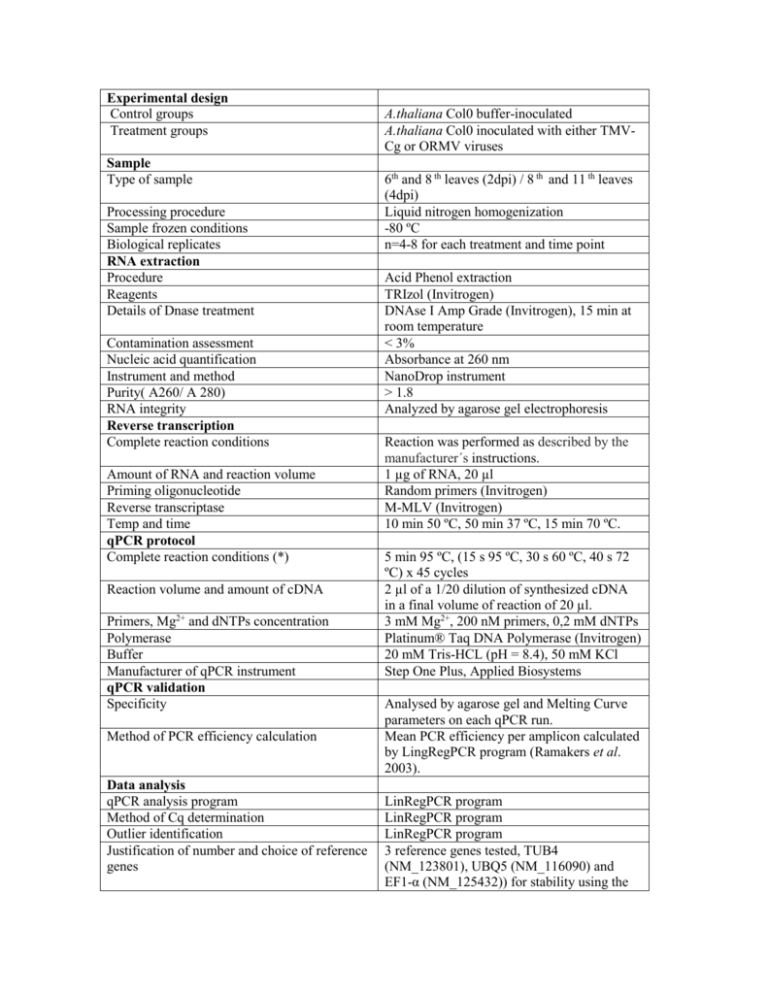
Experimental design Control groups Treatment groups Sample Type of sample Processing procedure Sample frozen conditions Biological replicates RNA extraction Procedure Reagents Details of Dnase treatment Contamination assessment Nucleic acid quantification Instrument and method Purity( A260/ A 280) RNA integrity Reverse transcription Complete reaction conditions Amount of RNA and reaction volume Priming oligonucleotide Reverse transcriptase Temp and time qPCR protocol Complete reaction conditions (*) Reaction volume and amount of cDNA Primers, Mg2+ and dNTPs concentration Polymerase Buffer Manufacturer of qPCR instrument qPCR validation Specificity Method of PCR efficiency calculation Data analysis qPCR analysis program Method of Cq determination Outlier identification Justification of number and choice of reference genes A.thaliana Col0 buffer-inoculated A.thaliana Col0 inoculated with either TMVCg or ORMV viruses 6th and 8 th leaves (2dpi) / 8 th and 11 th leaves (4dpi) Liquid nitrogen homogenization -80 ºC n=4-8 for each treatment and time point Acid Phenol extraction TRIzol (Invitrogen) DNAse I Amp Grade (Invitrogen), 15 min at room temperature < 3% Absorbance at 260 nm NanoDrop instrument > 1.8 Analyzed by agarose gel electrophoresis Reaction was performed as described by the manufacturer´s instructions. 1 µg of RNA, 20 µl Random primers (Invitrogen) M-MLV (Invitrogen) 10 min 50 ºC, 50 min 37 ºC, 15 min 70 ºC. 5 min 95 ºC, (15 s 95 ºC, 30 s 60 ºC, 40 s 72 ºC) x 45 cycles 2 µl of a 1/20 dilution of synthesized cDNA in a final volume of reaction of 20 µl. 3 mM Mg2+, 200 nM primers, 0,2 mM dNTPs Platinum® Taq DNA Polymerase (Invitrogen) 20 mM Tris-HCL (pH = 8.4), 50 mM KCl Step One Plus, Applied Biosystems Analysed by agarose gel and Melting Curve parameters on each qPCR run. Mean PCR efficiency per amplicon calculated by LingRegPCR program (Ramakers et al. 2003). LinRegPCR program LinRegPCR program LinRegPCR program 3 reference genes tested, TUB4 (NM_123801), UBQ5 (NM_116090) and EF1-α (NM_125432)) for stability using the Description of normalization methods Number of technical replicates Statistical method Software Repeatability (intraassay variation) Cq SD error Bestkeeper stability algorithm. EF1- α was chosen as the most stable reference gene. (Pfaffl et al. 2002): 2 Permutation test fgStatistics software (Di Rienzo J.A, 2009, (http://sites.google.com/site/fgStatistics/) Between 0.05 and 0.20 depending on the assayed amplicon.
