118229H_Msc_ResearchPaper
advertisement
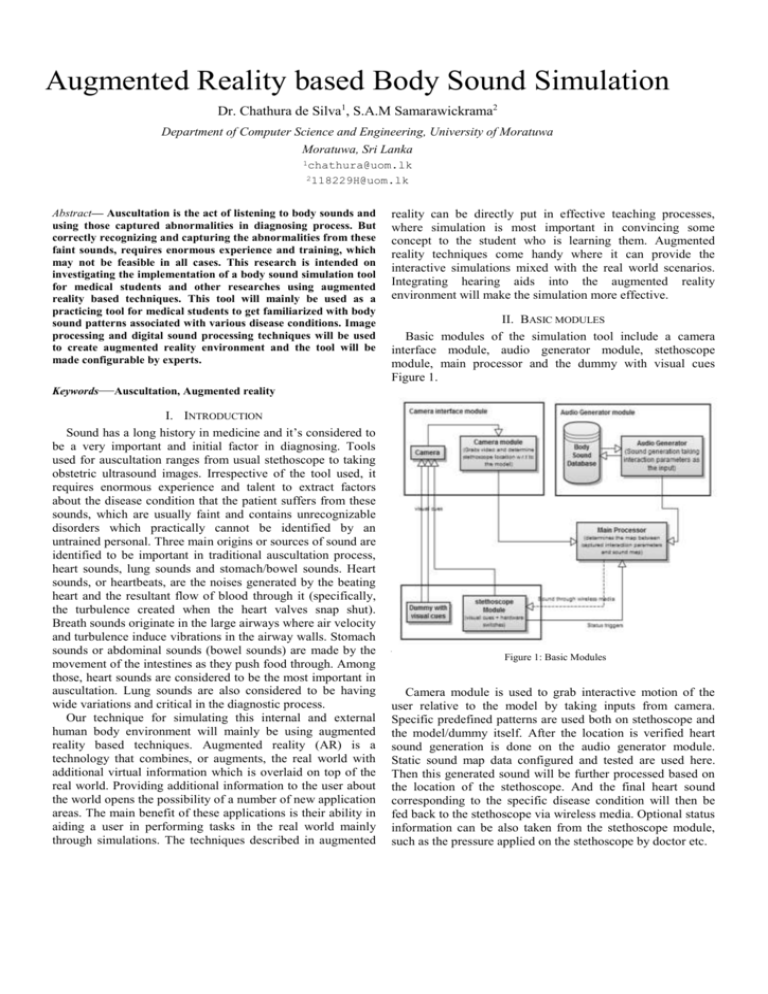
Augmented Reality based Body Sound Simulation Dr. Chathura de Silva1, S.A.M Samarawickrama2 Department of Computer Science and Engineering, University of Moratuwa Moratuwa, Sri Lanka 1chathura@uom.lk 2118229H@uom.lk Abstract— Auscultation is the act of listening to body sounds and using those captured abnormalities in diagnosing process. But correctly recognizing and capturing the abnormalities from these faint sounds, requires enormous experience and training, which may not be feasible in all cases. This research is intended on investigating the implementation of a body sound simulation tool for medical students and other researches using augmented reality based techniques. This tool will mainly be used as a practicing tool for medical students to get familiarized with body sound patterns associated with various disease conditions. Image processing and digital sound processing techniques will be used to create augmented reality environment and the tool will be made configurable by experts. Keywords—Auscultation, Augmented reality I. INTRODUCTION Sound has a long history in medicine and it’s considered to be a very important and initial factor in diagnosing. Tools used for auscultation ranges from usual stethoscope to taking obstetric ultrasound images. Irrespective of the tool used, it requires enormous experience and talent to extract factors about the disease condition that the patient suffers from these sounds, which are usually faint and contains unrecognizable disorders which practically cannot be identified by an untrained personal. Three main origins or sources of sound are identified to be important in traditional auscultation process, heart sounds, lung sounds and stomach/bowel sounds. Heart sounds, or heartbeats, are the noises generated by the beating heart and the resultant flow of blood through it (specifically, the turbulence created when the heart valves snap shut). Breath sounds originate in the large airways where air velocity and turbulence induce vibrations in the airway walls. Stomach sounds or abdominal sounds (bowel sounds) are made by the movement of the intestines as they push food through. Among those, heart sounds are considered to be the most important in auscultation. Lung sounds are also considered to be having wide variations and critical in the diagnostic process. Our technique for simulating this internal and external human body environment will mainly be using augmented reality based techniques. Augmented reality (AR) is a technology that combines, or augments, the real world with additional virtual information which is overlaid on top of the real world. Providing additional information to the user about the world opens the possibility of a number of new application areas. The main benefit of these applications is their ability in aiding a user in performing tasks in the real world mainly through simulations. The techniques described in augmented reality can be directly put in effective teaching processes, where simulation is most important in convincing some concept to the student who is learning them. Augmented reality techniques come handy where it can provide the interactive simulations mixed with the real world scenarios. Integrating hearing aids into the augmented reality environment will make the simulation more effective. II. BASIC MODULES Basic modules of the simulation tool include a camera interface module, audio generator module, stethoscope module, main processor and the dummy with visual cues Figure 1. A. Figure 1: Basic Modules Camera module is used to grab interactive motion of the user relative to the model by taking inputs from camera. Specific predefined patterns are used both on stethoscope and the model/dummy itself. After the location is verified heart sound generation is done on the audio generator module. Static sound map data configured and tested are used here. Then this generated sound will be further processed based on the location of the stethoscope. And the final heart sound corresponding to the specific disease condition will then be fed back to the stethoscope via wireless media. Optional status information can be also taken from the stethoscope module, such as the pressure applied on the stethoscope by doctor etc. III. INTERFACING CAMERA MODULE, OBJECT REGISTRATION AND MOVEMENT TRACKING Camera position and illumination scheme was chosen considering the real environment where the apparatus is actually installed. Object registration was done using augmented reality markers. Marker size, orientation, positions and content were designed in such a way that they provide transformation invariant object registration and maximum occlusion handling. Entire process of object registration and interaction determination was done in real time. A. Important aspects of the real environment, illumination scheme and camera positioning The environment in which this simulation apparatus is installed would be a hospital, or a similar place where the dummy will be laid horizontally with one or more doctors and other assistants standing nearby, examining the patient. During the auscultation process the doctor will remain almost stationary. The typical poses and approaches during auscultation will block sideways ( Figure 2). But the top view will be least occluded and may reveal many unblocked regions. And since the doctor’s approach is always restricted to sideways but never from the top or bottom ends during upper body auscultation, we can consider top and bottom ends also to be providing views with minimal occlusions. shadowing effect was found to be the best illumination scheme. B. Robust registration of object and movement tracking using circular markers Without using traditional markers [8] or an existing toolkit, markers which consist of circular shapes where the marker patterns were chosen to be having close correlation but significant absolute difference were used. Close correlation between markers lead to choose different but known maker of the same class during an occlusion of the pattern that is being searched. But the significant difference between markers provides a clue for dropping that selection, or provides a means of making sure whether an actual occlusion has occurred. Figure 3: Tested marker patterns Figure 2: Typical poses during auscultation (generic case) So the optimal region for the camera to be fixed for minimal occlusions/interference was found to be within the shaded region in Figure 2. Also, placing the camera at the doctor’s eye level helps to get more close emulation of the doctor’s view. An illumination scheme that minimizes external interference which caused by shadows and other varying lightening conditions has to be implemented for this scenario. Reconsidering Figure 2, it can be clearly seen that illumination scheme which contains a light source on the sideways of the patient’s bed would create more shadows than using sources on top and/or bottom sides of the patient’s bed. Since the chest area or the upper body has more importance in this simulation, keeping source on the top side rather than bottom, or keeping sources at both ends which cancels out any Circular patters used for the markers in this research are depicted in Figure 3. By tracking markers in the order A→ B → C, we will utilize the property of close correlation between them in identifying occlusions. For example, matching for pattern ‘ A ’ , with the presence of ‘B’ and ‘C’ would provide best match location near pattern ‘A’ if it is not occluded. During an occlusion either ‘B’ or ‘C’ will be tracked due to their higher correlation with pattern ‘A’. Tracking of pattern ‘A’ during occlusions and corresponding difference values with original template ‘A’ is given in Table 1. Once a match is found we can exploit the fact that it’s difference between the intended markers (marker ‘A’ in this case), should always be less than the absolute difference with other markers. And if the absolute difference is found to be higher, then we can assume an occlusion. TABLE 1: CORRELATION AND DIFFERENCE VARIATION DURING OCCLUSIONS Marker A matched (with presence and occlusion of itself and others) A, B and C Markers present Absolute Differences of matched results with marker B and C C only A 609 908 854 B 820 501 823 C 918 753 483 C. Implementation Standard web cam, which provides 320x240 images at a maximum of 30fps, was selected as the camera. This module was fixed rigidly around 5’ 6’’ feet (standard human height) on top of the plane in which the dummy lies. This helped in providing images which has least interruptions by doctor’s actions, and also it simulated the actual viewpoint of the doctor. Visual cues or augmented reality markers were placed avoiding the process critical region. Marker on the stethoscope is placed on the low frequency bell since it’s found to be the place which is least occluded. Also an initial calibration process is carried out in order to collect dummy specific data such as relative locations of jugular notch, xiphoid process and left and right coastal margins and marker templates. Center marker template, right marker template, left marker template and a template of marker placed on stethoscope are also captured and stored during this process. Since the used markers contains patterns with sharp edges (higher gradient), gradient images was found to be providing better details about the marker locations. Sobel operator is used as the gradient operator (Equation 1). Equation 1: Sobel masks used The preprocessed template images with sobel operator showed clear bimodal histograms where an optimal threshold could always be found which separates the marker pattern from its background. Otsu’s method for thresholding was decided to apply on the original template and matched template images and before calculating differences. If at least two markers were tracked the dummy feature matrix (which consists of locations of jugular notch, xiphoid process left and right coastal margins) is filled using calculated marker positions mapped onto initial calibration data. Found marker positions and calculated parameters were used with the following 2D transformation matrix; where α, dx and dy are the rotation, x-offset and y-offset of the dummy. Equation 2: Multiplication with 2D transformation matrix Distance between jugular notch and xiphoid process, distance between xiphoid process and lower margin of the rib cage and the distance between left and right coastal margins are taken as governing factors that decides uniqueness of the physical structure of any human being. In order to support different dummy structures the coordinate system of the dummy is assigned with two different scale factors thus dividing it into two parts (main points of separation - jugular notch, xiphoid process and coastal margins). This separation was also taken into account while calculating the final location of the stethoscope on the body map where the sound map will be augmented into. IV. HEART, LUNG, BAWL SOUND VARIATION AND INTERFACING HUMAN BODY SOUND MAP Awareness of sound propagation patterns inside human body is essential in configuring general sound map. Human body has few distinct sound sources which will interpolate themselves to produce a unique sound at a given location. But this sound propagation patterns can be considered to be unique for a person. Also the effects caused by abnormalities are minute. So they are found to be best recognized and interpreted by trained personals only. A. Architecture of the sound map - decisions made and justification Decisions taken regarding the structure of the sound map… Jugular notch is assigned as origin. Locations of common auscultation sites are known and marked. Some special points are assigned with original sounds recorded from patient. And other locations will use a dynamically generated audio signal. (usually generated interpolating sounds at common auscultation sites) Recorded original sounds are assigned to corresponding common auscultation sites. Sounds generated at other locations will be explained using sounds associated with common auscultation sites. Sound map calibration will be done to assign simulated sounds onto the sound map. Calibration of this sound map will be done by an expert (experienced doctor). Each case and configuration (normal breath, breath held up and deep breath) will contain a unique sound map. Each case map will be certified by a panel of experts and apprentices. Error status is assumed when a sound corresponds to any point other than non-auscultation site is requested. But the generated sound will still be taken as the output. Justifications… Doctors are mainly concerned about the sounds heard at common auscultation sites. So it is better to use original sounds at those points. Precise interpretation is not essential for other locations. Since they are not be used in an auscultation process. The interpretation given by experts can be considered to be sufficiently correct. Minute changes which occur during abnormalities are best interpreted by trained personals (predicting output based on waveform analyzing is error prone and not robust). B. Implementation Prerecorded body sounds with minimal noise are used for constructing sound map. Separate sound maps were constructed for each case and each configuration. Entire upper body area is divided into several rectangular cells. Size and location of rectangular cells are defined by an expert, and are unique for each case. Audio signal within each cell is considered to be constant. Prerecorded sound files are used at common auscultation sites. Also the facility of using sounds other than the sounds heard at common sites is provided. Example map constructed for the case mitral valve stenosis is depicted in Figure 4. A. Observations 1) Case 01 - Normal operation Figure 5: Error (absolute distance between tracked and optimal locations) variation - Normal operation Front view map Back view map Figure 4: Mitral valve stenosis sound map Frames tracked correctly = 385 / 400 Overall percentage error during normal operation = 96.25% 2) Case 02 – low lightening conditions V. OBSERVATIONS, RESULTS & ANALYSIS The functionality, performance and robustness of the camera module and the performance and accuracy of generated sound maps were first separately evaluated. And then a combined score is used to depict the overall accuracy. A. Accuracy evaluation of used object registration and stethoscope tracking techniques In order to determine the percentage error, tracked location coordinates are compared with manually determined optimal locations. Various measures including the Euclidian distance between manually marked optimal location and computed location, percentage of frames in error and total effective error percentage (percentage of critical errors, which actually affects the process) are used in measuring the overall accuracy of object registration and tracking process. Sample videos had to be taken covering all possible environmental conditions that might occur during auscultation process. Typical hospital environment is assumed and some possible environmental conditions were extracted by simple observation and via discussions with medical resource people. Performance evaluation was done for the following cases. Normal operation Environments with low brightness condition Fast and slow moving shadows Partial or full occlusions Rapid transformations Samples were processed and tested separately. The visible optimal location is then marked on each frame manually for error calculation (Equation 3). Figure 6: Error (absolute distance between tracked and optimal locations) variation - Low lightening conditions Frames tracked correctly = 363 / 400 Overall percentage error with low lightening = 90.75% 3) Case 03 – effect of shadows Figure 7: Error (absolute distance between tracked and optimal locations) variation -with shadows Frames tracked correctly = 255 / 300 Overall percentage error with shadows = 85.00% Equation 3: Location tracking error 4) Case 03 – Occlusions Figure 8: Error (absolute distance between tracked and optimal locations) variation – Occlusions stethoscope handling mechanism in case of continuous failures. But from the results gathered by testing the apparatus under various environmental conditions, displays that the tracking process is accurate and robust enough to meet the requirements. B. Accuracy evaluation of sound maps Sound maps for calibrated cases were forwarded to a panel of experts for testing and confirmation. During a test, the selected panel member is exposed to all cases and his/her response and comments regarding the accuracy of representation of sound maps were recorded as a percentage. And those responses were averaged in order to provide an overview accuracy score for each case. Only some common cases are calibrated and tested here. Average accuracy scores for some simulated cases are depicted in Figure 10. Frames tracked correctly = 281 / 300 Overall percentage error with shadows = 93.77% 5) Case 03 – Transformed object Figure 10: Average percentage of accuracy - cases Figure 9: Error (absolute distance between tracked and optimal locations) variation – Transformations Frames tracked correctly = 238 / 300 Overall percentage error with shadows = 79.33% B. Failure scenarios Fast stethoscope movements Fast and slow stethoscope movements are caused by moving the stethoscope from one auscultation site to another during auscultation process. Failures during fast stethoscope movements do not affect the overall accuracy of the simulation since stethoscope has to be kept stationary during an auscultation process. Occlusions of 2 or more markers on dummy Shadows and user movements may cause two or markers to be occluded simultaneously. Occlusion of the marker on the stethoscope The manner in which the user holds the stethoscope may cause marker on the stethoscope to be occluded. Above all are categorized as failures and system will not update the new location instead keeps on using the old location. User may recalibrate the system or use an alternate Another test was conducted with a panel of final year medical students (15 students). Testers were directly exposed to a sound map which was selected in random, and they were asked to identify the case which is being simulated. The percentage of a case is successfully recognized by the panel of testers is recorded. And this is also used to depict the accuracy of sound map calibration (Figure 11). Figure 11: Case Recognition percentage From the above results it can be clearly seen that the manual calibration of sound maps can match with the actual perception of trained tester. And it also represented a general solution agreed by the majority of testing panel. So it can be concluded that manual calibration of sound maps is a success. VI. CONCLUSION Body sound simulation via augmented reality techniques has several advantages over tradition auscultation simulation procedures. Traditional simulators usually used static sound sources fixed at some predefined locations inside a hollow space. But the main problem with this type of traditional simulators is the uncontrollability of the sound propagation patterns. Usually body sounds originates inside enclosed chambers or tubes and are localized and usually blocked by other internal organs. So there will always be an undesirable interference caused by nearby sources in traditional simulators. This can be effectively managed in our approach. The sound map is manually configured and the calibration process is equipped with freedom sufficient enough to configure the sound propagation path in an optimal manner. Some abnormalities cause disorders in human physique which results in ‘nonstandard’ organ sizes and locations. Counting ribs is the most common method of finding common auscultation sites. But if the doctor suspects that the heart has enlarged, then he usually will not depend on the rib count for finding relevant auscultation site. Common auscultation sites are also made configurable in our approach, making it possible for the augmented sound map to deal with internal structural changes. So augmented sound map techniques provide more accurate and realistic simulations than traditional simulators. Traditional simulators with high end inbuilt speakers and sound mixers usually contains at least some costly hardware. Whereas this augmentation approach only requires consumer level web camera, dummy, wireless speakers or similar mechanism to transmit generated sound to the user stethoscope and some visual cues that can be acquired with low or no cost. And the calibration process is easy and purely software based. But also there are some problems and disadvantages. The method used for calibrating sound map was mainly based on the perception and experience of the calibrator. During calibration the calibrator will put more weight on the features of abnormalities that are more profound for him. But that sound pattern may not be found as the unique recognizer associated with that simulated disease condition, by others. So the method of calibration must be made standardized to make everyone happy. Overall performance and the accuracy score of the simulation were found to be sufficient enough. Stethoscope tracking process displayed high success rates (over 80%) for all tests conducted under various environmental conditions. User feedback on simulated cases and finally on overall simulation environment was also found to be positive. augmented reality techniques may be able to provide more accurate and universal behavior. Finding better techniques to improve the robustness of object registration and tracking process is another enhancement. The performance of 3D markers, techniques which utilizes more visual cues, defining marker patterns with better occlusion invariance etc. can be tested there. VII. FUTURE WORK A method, solely based on human experience is used for sound map calibration. This can be standardized by either using a method that uses the internal structure of the human body in calculating sound propagation model. This was found to be an untouched research area where loads of new facts are yet to be discovered. With a proper sound propagation model, [17] REFERENCES [1] [1] Medical Dictionary TheFreeDictionary. (2011) TheFreeDictionary. [Online]. http://medical-dictionary.thefreedictionary.com/auscultation [2] [2] The free encyclopedia Wikipedia. (2011, October) Wikipedia. [Online]. http://en.wikipedia.org/wiki/Heart_sounds [3] [3] Robert.J. Callan. CSU Auscultation Library. [Online]. http://www.cvmbs.colostate.edu/clinsci/callan/breath_sounds.htm [4] [4] U.S. National Library of Medicine. (2011, August) Medine Plus. [Online]. http://www.nlm.nih.gov/medlineplus/ency/article/003137.htm [5] [5] Health Ehow. (1999, January) EHow Health - Why Do Doctors Use Stethoscopes. [Online]. http://www.ehow.com/howdoes_4914956_why-do-doctors-use-stethoscopes.html [6] [6] Shahzad Malik, "Robust Registration of Virtual Objects for RealTime," The Ottawa-Carleton Institute for Computer Science, Ottawa, Ontario, MSc Thesis May 8, 2002. [7] James R. Vallino, "Interactive Augmented Reality," University of Rochester, Rochester, NY, PhD Thesis November 1998. [8] Hirokazu Kato. (2007, November) ARToolKit. [Online]. http://www.hitl.washington.edu/artoolkit/ [7] [8] [9] [9] (2009, February) http://www.artag.net/index.html [10] [10] Chetan Kumar, G. Shetty, and Mahesh Kolur, "Interactive Elearning system using pattern recognition and augmented reality ," in International Conference on Teaching, Learning and Change, 2011. [11] Gilles Simon, Andrew Fitzgibbon, and Andrew Zisserman, "Markerless Tracking using Planar Structures in the Scene," in Proceedings of the IEEE International Symposium on Augmented Reality (ISAR), 2000, pp. 120-128. [12] Masayuki Kanbara, Naokazu Yokoya, and Haruo Takemura, "A Stereo Vision-based Augmented Reality System with Marker and Natural Feature Tracking," in Seventh International Conference on Virtual Systems and Multimedia, 2001, pp. 455-462. [13] B. H. Thomas and W. Piekarski, "Glove Based User Interaction Techniques for Augmented Reality in an Outdoor Environment," Virtual Reality, no. 6, pp. 167–180, 2002. [14] Jan T. Fischer, "Rendering Methods for Augmented Reality," Faculty of information and cognitive sciences, University of UBINIG, phD Thesis 2006. [15] Rachael P. (2011, June) Physiopedia. [Online]. http://www.physiopedia.com/index.php5?title=Auscultation [11] [12] [13] [14] [15] [16] ARTag. [Online]. [16] Barry Griffith King and Mary Jane Showers, Human anatomy and physiology, 5th ed., 1964. [17] Loyola University Chicago. (2011) Stritch School of Medicine. [Online]. http://www.meddean.luc.edu [18] [18] Nixon Mcinnes. (2006, January) Ambulance technician study. [Online]. http://www.ambulancetechnicianstudy.co.uk/patassess.html [19] [19] McGill University. Welcome to the McGill University Virtual Stethoscope. [Online]. http://sprojects.mmi.mcgill.ca/mvs/ [20] [20] T. Takashinmal, T. Masuzawam, and Y.Fukupi, "A New Cardiac Auscultation Simulator," Cardiol, no. 13, pp. 869-872, 1990. [21] [22] [21] Amend Greg J and Craig S.Tinker, "ELECTRONIC AUSCULTATION SYSTEM FOR PATIENT SIMULATOR," Electronic US 6,220,866 B1, April 24, 2001. [22] BR biomedicals Pvt Ltd. (2010) Lung Sound Auscultation Simulator. [Online]. http://www.brbiomedicals.com/lung_sound.html [23] [23] MITAKA SUPPLY CO LTD. (2006) Sakamoto Auscultation Simulator. [Online]. http://www.mitakasupply.com/02en_models/m164.php [24] [24] Takashina Tsunekazu and Masashi. Shimizu. (1997, January) http://www.kyotokagaku.com. [Online]. http://www.kyotokagaku.com/products/detail01/pdf/m84-s_catalog.pdf [25] [25] wikibooks. (2012, January) Human Physiology/The cardiovascular system. [Online]. http://en.wikibooks.org/wiki/Human_Physiology/The_cardiovascular_s ystem [26] [26] Phua Koksoon, Dat Tran Huy, Chen Jianfeng, and Shue Louis, "Human identification using heart sound," Institute for Infocomm Research, Singapore, Master Thesis. [27] David Theodor Kerr Gretzinger, "Analysis of Heart Sounds and Murmurs by Digital Signal Manipulation," Institute of Biomedical Engineering, University of Toronto, Toronto, PhD Thesis 1996. [28] Nigam V and Priemer R, "Cardiac Sound Separation," University of Illinois at Chicago, Chicago, USA, Master Thesis. [29] The Regents of the University of California. (2008, August) A Practical Guide to Clinical Medicine. [Online]. http://meded.ucsd.edu/clinicalmed/lung.htm [27] [28] [29] [30] [30] University of Michigan. (2005) University of Michigan Heart Sound and Murmur Library. [Online]. http://www.med.umich.edu/lrc/psb/heartsounds/index.htm [31] [31] 3M. (2012) Heart & Lung Sounds, Audio clips to sharpen your auscultation skills. [Online]. http://solutions.3m.com/wps/portal/3M/en_US/3MLittmann/stethoscope/littmann-learning-institute/heart-lung-sounds/ [32] [32] Ronald T. Azuma, "A Survey of Augmented Reality," Teleoperators and Virtual Environments, vol. 6, no. 4, pp. 355-385, August 1997. [33] Mark Billinghurst Hirokazu Kato, "Marker Tracking and HMD Calibration for a Video-based Augmented Reality Conferencing System," in Proceedings of the 2nd IEEE and ACM, 2001. [34] Jun Rekimoto, "Matrix: A Realtime Object Identification and Registration Method for Augmented Reality," Proceedings of Computer Human Interaction, no. 3rd Asia Pacific, pp. 63-68. [35] Hirokazu Kato, Mark Billinghurst, and Ivan Poupyrev, "ARToolKit User Manual," Human Interface Technology Lab, University of Washington, User Manual 2000. [36] Holger Regenbrecht, Gregory Baratoff, and Michael Wagner, "A Tangible AR Desktop Environment," Computer & Graphics, no. 25, pp. 755-763, 2001. [37] Mark Billinghurst, Hirokazu Kato, and Ivan Poupyrev, "The MagicBook – Moving Seamlessly between Reality and Virtuality," IEEE Computer Graphics and Applications, May/June 2001. [38] Mark Billinghurst, Hirokazu Kato, and Ivan Poupyrev, "The MagicBook: A Transitional AR Interface," Computer & Graphics, no. 25, pp. 745-753, 2001. [39] Jose Molineros and Rajeev Sharma, "Real-Time Tracking of Multiple Objects Using Fiducials for Augmented Reality," Real-Time Imaging, no. 7, pp. 495-506, 2001. [40] R. Azuma et al., "Recent Advances in Augmented Reality," IEEE Computer Graphics and Applications, vol. 21, no. 6, pp. 34–47, November/December 2001. [41] S, Kraman Steve, Wodicka George R, Pressler Gary A, and Pasterkamp Hans, "Comparison of lung sound transducers using a bioacoustic transducer testing system," Journal of Applied Physiology, vol. 101, no. 2, pp. 469-476, August 2006. [33] [34] [35] [36] [37] [38] [39] [40] [41]
