Hominid Evolution ADI
advertisement
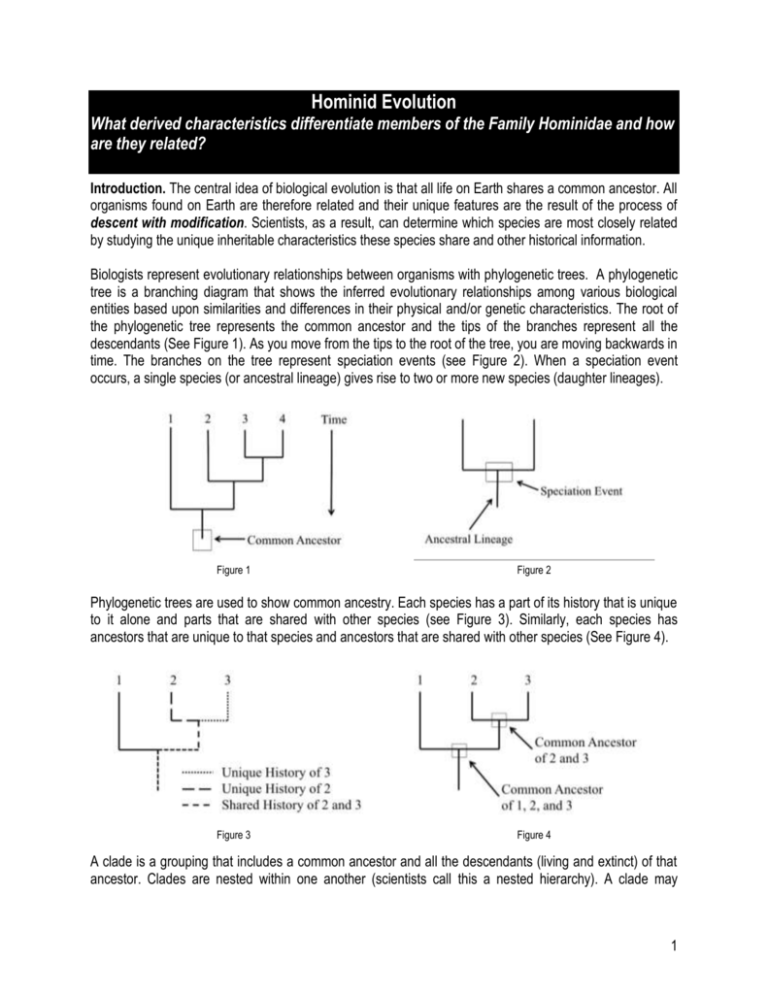
Hominid Evolution What derived characteristics differentiate members of the Family Hominidae and how are they related? Introduction. The central idea of biological evolution is that all life on Earth shares a common ancestor. All organisms found on Earth are therefore related and their unique features are the result of the process of descent with modification. Scientists, as a result, can determine which species are most closely related by studying the unique inheritable characteristics these species share and other historical information. Biologists represent evolutionary relationships between organisms with phylogenetic trees. A phylogenetic tree is a branching diagram that shows the inferred evolutionary relationships among various biological entities based upon similarities and differences in their physical and/or genetic characteristics. The root of the phylogenetic tree represents the common ancestor and the tips of the branches represent all the descendants (See Figure 1). As you move from the tips to the root of the tree, you are moving backwards in time. The branches on the tree represent speciation events (see Figure 2). When a speciation event occurs, a single species (or ancestral lineage) gives rise to two or more new species (daughter lineages). Figure 1 Figure 2 Phylogenetic trees are used to show common ancestry. Each species has a part of its history that is unique to it alone and parts that are shared with other species (see Figure 3). Similarly, each species has ancestors that are unique to that species and ancestors that are shared with other species (See Figure 4). Figure 3 Figure 4 A clade is a grouping that includes a common ancestor and all the descendants (living and extinct) of that ancestor. Clades are nested within one another (scientists call this a nested hierarchy). A clade may 1 include thousands of species or just a few. Some examples of clades at different levels are marked in the phylogenic tree shown in Figure 5. Notice how clades are nested within larger clades. Biologists often represent time on phylogenies by drawing the branch lengths in proportion to the amount of time that has passed since that lineage arose. Figure 6 provides an example of how a phylogenetic tree can be used to illustrate when different lineages arose or went extinct in the history of life. Figure 5 Humans and their immediate ancestors, collectively known as hominids, are notable among the rest of the primates for their bipedal locomotion, slow rate of maturation, and large brain size (see Figure 7). Our current understanding of the evolutionary history of hominids is derived largely from the findings of paleontology and anthropology. Thousands of fossils of human ancestors and extinct relatives have been unearthed. Each fossil, whether it is a complete skeleton or a single tooth, contributes significantly to our understanding of the origins of human. In this investigation, you will have an opportunity to explore the evolutionary history of hominids. Figure 6 Figure 7. Several different Hominid skulls Your Task: Develop a phylogenetic tree for living and extinct primates and then use this information to draw inferences about the evolutionary history of humans. The guiding question for this investigation is: What derived characteristics differentiate the members of the Family Hominidae and how are they related? Materials: You will have the opportunity to view a set of seven hominid skulls. You also will be provided with a data set that includes the oldest and youngest specimens found in the fossil record, the biogeography of each hominid species, and skull characteristics of each hominid species. Hominid skull models (optional)* Hominid Evolution Data Set Hominid Evolution Phylogenetic Tree Template 2 Getting Started: Carefully examine the data set you have been provided to determine the similarities and differences between the hominid species. There are several features and measurements provided in Table 2 that scientists use to describe a hominid skull. These features and measurements have been provided to you in the data set. Table 2. Features of Hominid skulls Aspect of the Skulls Where Located The braincase and face What is the SIZE OF THE BRAINCASE (front to back and side to side)? Is a SAGITTAL CREST present? Is the MASTOID PROCESS relatively flat OR does it noticeably protrude (project)? Are the NASAL BONES raised (arched) OR flat? What is the LENGTH of the MANDIBLE [cm]? Figure 8 The dentition: Measure the COMBINED WIDTH or BREADTH of the 4 INCISORS together. Does the CANINE tooth project above the chewing surfaces of the other teeth? Is there a space between the CANINE tooth and the INCISORS? (this called a CANINE DIASTEMA) Measure the COMBINED LENGTH of the LEFT 2 PREMOLARS and 3 MOLARS together by measuring from the back of the last molar to the front of the first premolar [cm]. Figure 9 Next, you will create a phylogenetic tree using the template provided. Biologists begin the process of constructing a phylogenetic tree by collecting data about heritable traits that can be compared across species (such as the skull features listed in Table 2). Biologists then determine which species have a shared derived character and which do not. A shared derived character is one that two species have in common and has appeared in the lineage leading up to a clade. As a result, the character sets members of a clade apart from other individuals not in the clade. It is important to note, however, that a shared derived character does not need to be a new feature or a feature that has increased in size; a shared derived 3 character can also be a feature that has gotten smaller or has disappeared completely. For example, the absence of a sagittal crest might be a shared derived character in hominids that sets the members of a clade apart from other clades. One way to keep track of the presence or absence of the shared derived characters for each hominid is to create a chart such as the one shown in Table 3. Biologists then create the phylogenetic tree by grouping species into clades based on the number of shared derived characters they have. Figure 12 shows an example of phylogenetic tree that is based on the number derived characters shared by species 1-6 in Table 2. Notice that species 1 has the fewest number of shared derived characters (only A) and species 3-6 have the most (A, B, C, and D or A, B, C, and E). Species 3 and 4 share different characters (A, B, C, and D) than 5 and 6 (A, B, C, and E) – this means species 3 and 4 shared more of their evolutionary history than species 5 and 6 do even though they have the same number of shared derived characters. Table 3. Presence of a shared derived characters for each species Species 1 2 3 4 5 6 A Y Y Y Y Y Y Shared Derived Character B C D E Total N N N N 1 Y N N N 2 Y Y Y N 4 Y Y Y N 4 Y Y N Y 4 Y Y N Y 4 Figure 10 Investigation Proposal Required: Yes X No Argumentation Session: Once your group has finished collecting and analyzing your data, prepare a whiteboard that you can use to share your initial argument. Your whiteboard should include all the information described below and as shown Figure 11. The Research Question: Our Claim: Our Evidence: Our Justification of the Evidence: Evidence: Analyze each piece of evidence in the data set to determine how it supports the construction of your phylogenetic tree. Claim: Construct the phylogenetic tree on the Figure 11. Information needed on a Whiteboard template provided. o Label each node with the name of the hominid it represents. o Label each clade with the ancestral and derived characteristics that sets it apart. o Provide a statement that indicates the hominid you believe Homo sapiens are most closely 4 related in the box on the paper whiteboard template. o Be prepared to share your phylogenetic tree with other groups. Justification: Note how the evidence supports your constructed phylogenetic tree and how the concept of descent with modification applies to hominids. To share your argument with others, we will be using a Round-Robin format. This means that one member of your group will stay at your lab station to share your groups’ argument while the other members of your group go to the other lab stations one at a time in order to listen to and critique the arguments developed by your classmates. The goal of the argumentation session is not to convince others that your argument is the best one; rather the goal is to identify errors or instances of faulty reasoning in the arguments so these mistakes can be fixed. You will therefore need to evaluate the content of the claim, the quality of the evidence used to support the claim, and the strength of the justification of the evidence included in each argument that you see. In order to critique an argument, you will need more information than what is included on the whiteboard. You might, therefore, need to ask the presenter one or more follow up questions such as: What did you do to analyze your data? Why did you decide to do it that way? Is that the only way to interpret the results of your analysis? How do you know that your interpretation of your analysis is appropriate? Why did your group decide to present your evidence in that manner? What other claims did your group discuss before you decided on that one? Why did your group abandon those alternative ideas? How confident are you that you claim is valid? What could you do to increase your confidence? Once the argumentation session is complete, you will have a chance to meet with your group and revise your paper whiteboard template. Your group might need to gather more data or design a way to test one or more alternative claims as part of this process. Remember, your goal at this stage of the investigation is to develop the most valid or acceptable answer to the research question! Report. Once you have completed your research, you will need to prepare an investigation report that consists of three sections. 1. Your completed phylogenetic tree of the hominids, including labels for the species and the derived characteristics that set aside each clade. 2. Your revised paper whiteboard template, including any additions or revisions your group made 3. Your response to the following reflection question, “Linnaean classification places genus between family and species. Discuss the derived characteristics that set the genus Homo from the other hominids on your phylogenetic tree. Cite evidence from the HHMI video and/or the ADI to substantiate your response.” 5


