Nuclide Chart, Radioactivity and Nuclear Reactions
advertisement
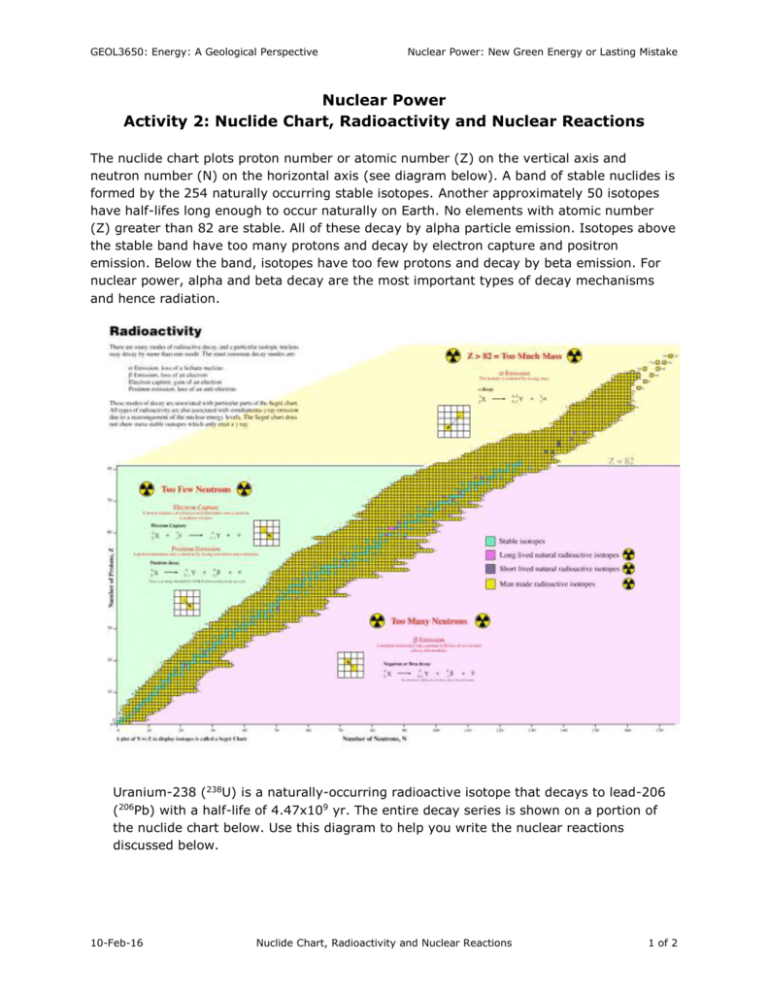
GEOL3650: Energy: A Geological Perspective Nuclear Power: New Green Energy or Lasting Mistake Nuclear Power Activity 2: Nuclide Chart, Radioactivity and Nuclear Reactions The nuclide chart plots proton number or atomic number (Z) on the vertical axis and neutron number (N) on the horizontal axis (see diagram below). A band of stable nuclides is formed by the 254 naturally occurring stable isotopes. Another approximately 50 isotopes have half-lifes long enough to occur naturally on Earth. No elements with atomic number (Z) greater than 82 are stable. All of these decay by alpha particle emission. Isotopes above the stable band have too many protons and decay by electron capture and positron emission. Below the band, isotopes have too few protons and decay by beta emission. For nuclear power, alpha and beta decay are the most important types of decay mechanisms and hence radiation. Uranium-238 (238U) is a naturally-occurring radioactive isotope that decays to lead-206 (206Pb) with a half-life of 4.47x10⁹ yr. The entire decay series is shown on a portion of the nuclide chart below. Use this diagram to help you write the nuclear reactions discussed below. 10-Feb-16 Nuclide Chart, Radioactivity and Nuclear Reactions 1 of 2 GEOL3650: Energy: A Geological Perspective Nuclear Power: New Green Energy or Lasting Mistake 1. The first step in the decay series is from describing this step. U to 238 234Th . Derive the nuclear reaction Th 24n 238 92 234 90 U alpha decay 2. When the decay series reaches polonium-218 (218Po), there is a branch in the decay series. Write the two possible decay reactions at this point in the series. 218 84 214 82 Po Pb alpha decay 218 84 218 85 Po At 0 1 beta decay 3. At the end of the decay series mercury-206 (206Hg) decays to reaction for this transformation. 206 80 Hg Pb. Write the 206 Tl+ 10 206 81 beta decay 206 81 Tl 206 82 Pb+ 0 1 beta decay 10-Feb-16 Nuclide Chart, Radioactivity and Nuclear Reactions 2 of 2


