Nutrients load reduction by Wharf: We have partitioned the data into
advertisement

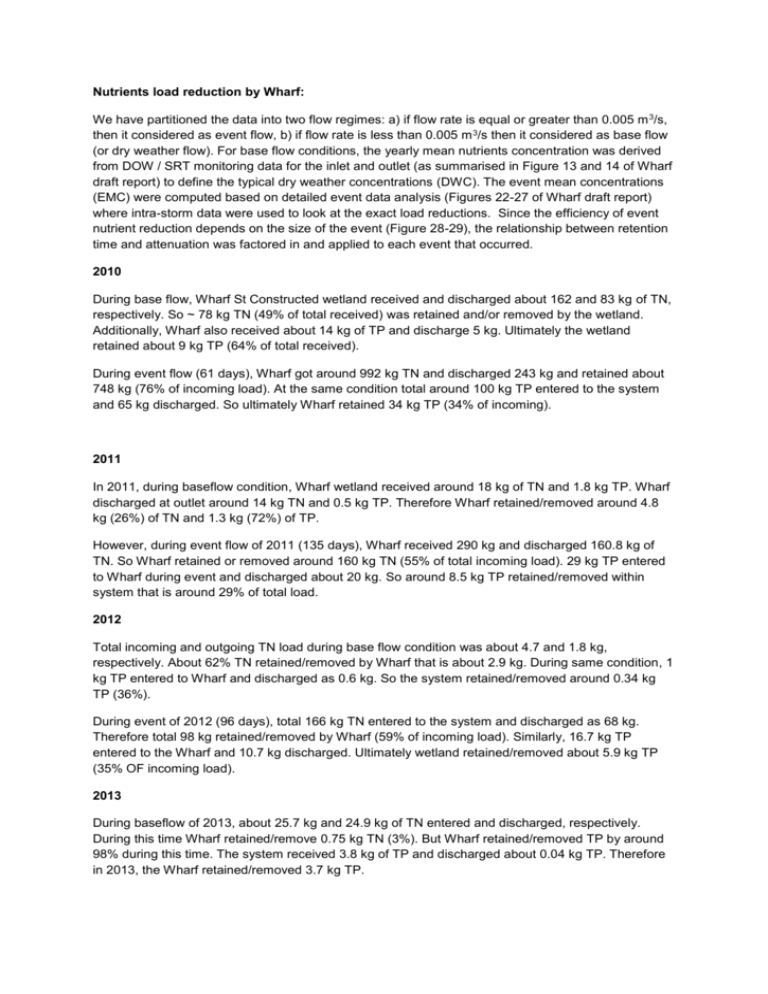
Nutrients load reduction by Wharf: We have partitioned the data into two flow regimes: a) if flow rate is equal or greater than 0.005 m 3/s, then it considered as event flow, b) if flow rate is less than 0.005 m 3/s then it considered as base flow (or dry weather flow). For base flow conditions, the yearly mean nutrients concentration was derived from DOW / SRT monitoring data for the inlet and outlet (as summarised in Figure 13 and 14 of Wharf draft report) to define the typical dry weather concentrations (DWC). The event mean concentrations (EMC) were computed based on detailed event data analysis (Figures 22-27 of Wharf draft report) where intra-storm data were used to look at the exact load reductions. Since the efficiency of event nutrient reduction depends on the size of the event (Figure 28-29), the relationship between retention time and attenuation was factored in and applied to each event that occurred. 2010 During base flow, Wharf St Constructed wetland received and discharged about 162 and 83 kg of TN, respectively. So ~ 78 kg TN (49% of total received) was retained and/or removed by the wetland. Additionally, Wharf also received about 14 kg of TP and discharge 5 kg. Ultimately the wetland retained about 9 kg TP (64% of total received). During event flow (61 days), Wharf got around 992 kg TN and discharged 243 kg and retained about 748 kg (76% of incoming load). At the same condition total around 100 kg TP entered to the system and 65 kg discharged. So ultimately Wharf retained 34 kg TP (34% of incoming). 2011 In 2011, during baseflow condition, Wharf wetland received around 18 kg of TN and 1.8 kg TP. Wharf discharged at outlet around 14 kg TN and 0.5 kg TP. Therefore Wharf retained/removed around 4.8 kg (26%) of TN and 1.3 kg (72%) of TP. However, during event flow of 2011 (135 days), Wharf received 290 kg and discharged 160.8 kg of TN. So Wharf retained or removed around 160 kg TN (55% of total incoming load). 29 kg TP entered to Wharf during event and discharged about 20 kg. So around 8.5 kg TP retained/removed within system that is around 29% of total load. 2012 Total incoming and outgoing TN load during base flow condition was about 4.7 and 1.8 kg, respectively. About 62% TN retained/removed by Wharf that is about 2.9 kg. During same condition, 1 kg TP entered to Wharf and discharged as 0.6 kg. So the system retained/removed around 0.34 kg TP (36%). During event of 2012 (96 days), total 166 kg TN entered to the system and discharged as 68 kg. Therefore total 98 kg retained/removed by Wharf (59% of incoming load). Similarly, 16.7 kg TP entered to the Wharf and 10.7 kg discharged. Ultimately wetland retained/removed about 5.9 kg TP (35% OF incoming load). 2013 During baseflow of 2013, about 25.7 kg and 24.9 kg of TN entered and discharged, respectively. During this time Wharf retained/remove 0.75 kg TN (3%). But Wharf retained/removed TP by around 98% during this time. The system received 3.8 kg of TP and discharged about 0.04 kg TP. Therefore in 2013, the Wharf retained/removed 3.7 kg TP. During event flow condition of 2013 (119 days), Wharf received about 324 kg TN. 54% of these TN retained/removed by Wharf (173 kg) and discharged about 150.5 kg TN. 32.6 and 23.7 kg of TP received and discharged in the system during event flow. About 8.8 kg TP retained/removed (27% of incoming load). 2014 Wharf released TN during base flow of 2014. Total about 52.3 kg TN received and 52.8 kg discharged. So 0.6 kg TN sourced from Wharf. Wharf also received ABOUT 4 kg of TP and discharged about 3.6 kg. Ultimately the system removed/retained about 0.37 kg TP (9%). However during event flow (24 days), 490 kg of TN entered to Wharf and amount them about 100 kg discharged from the system. So Wharf retained/removed about 389 kg (79% of incoming load). In 2014, 83 kg of TP also received by Wharf. Among these, 26.7 kg discharged from the system. So Wharf removed/ retained about 56 kg of TP (67%). Table 1. An approximate estimation of total load and load removal/retention by Wharf 2010 2011 2012 2013 2014 Base flow Event flow Base flow Event flow Base flow Event flow Base flow Event flow Base flow Event flow Inlet load (kg) Outlet load (kg) 162.09 991.90 18.89 290.17 4.696 166.07 25.71 324.30 52.25 490.21 83.27 242.95 14.02 129.31 1.80 67.66 24.95 150.57 52.86 100.66 TN Load diff (kg) 78.82 748.94 4.86 160.85 2.89 98.41 0.75 173.73 -0.60 389.55 Load removed/ retention (%) 49% 76% 26% 55% 62% 59% 3% 54% -1% 79% Inlet load (kg) Outlet load (kg) 14.492 99.71 1.8102 29.17 0.939 16.69 3.84 32.60 3.96 83.10 5.11 65.79 0.49 20.60 0.59 10.76 0.04 23.79 3.583 26.73 TP Load diff (kg) 9.37 33.91 1.32 8.56 0.34 5.92 3.79 8.81 0.37 56.36 Load removed/ retention (%) 65% 34% 73% 29% 36% 36% 99% 27% 10% 68%


