Topic_5__Probability_and_Statistics__Pre
advertisement
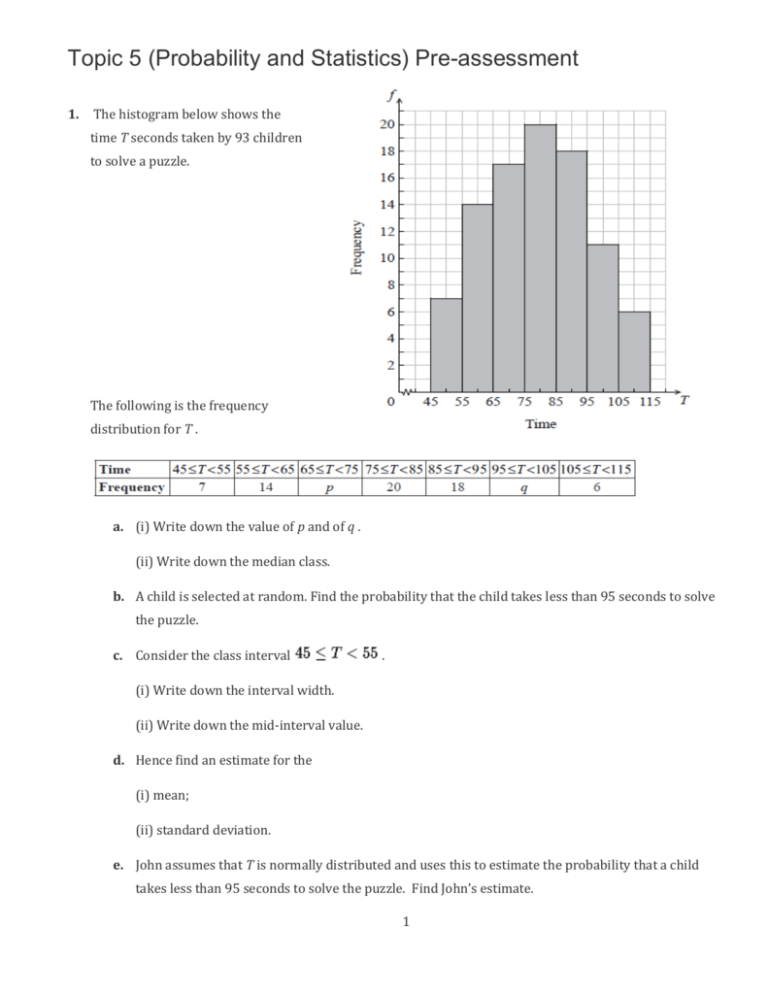
Topic 5 (Probability and Statistics) Pre-assessment 1. The histogram below shows the time T seconds taken by 93 children to solve a puzzle. The following is the frequency distribution for T . a. (i) Write down the value of p and of q . (ii) Write down the median class. b. A child is selected at random. Find the probability that the child takes less than 95 seconds to solve the puzzle. c. Consider the class interval . (i) Write down the interval width. (ii) Write down the mid-interval value. d. Hence find an estimate for the (i) mean; (ii) standard deviation. e. John assumes that T is normally distributed and uses this to estimate the probability that a child takes less than 95 seconds to solve the puzzle. Find John’s estimate. 1 2. The cumulative frequency curve to the right represents the marks obtained by 100 students. a. Find the median mark. b. Find the interquartile range. 3. There are nine books on a shelf. For each book, x is the number of pages, and y is the selling price in pounds (£). Let r be the correlation coefficient. a. Write down the possible minimum and maximum values of r . b. Given that , which of the following diagrams best represents the data. c. For the data in diagram D (on left) , which two of the following expressions describe the correlation between x and y ? perfect, zero, linear, strong positive, strong negative, weak positive, weak negative 4. A factory makes switches. The probability that a switch is defective is 0.04. The factory tests a random sample of 100 switches. a. Find the mean number of defective switches in the sample. b. Find the probability that there are exactly six defective switches in the sample. c. Find the probability that there is at least one defective switch in the sample. 2 5. The following table shows the average weights ( y kg) for given heights (x cm) in a population of men. Heights (x cm) 165 170 175 180 185 Weights (y kg) 67.8 70.0 72.7 75.5 77.2 a. The relationship between the variables is modelled by the regression equation .Write down the value of and of . b. Hence, estimate the weight of a man whose height is 172 cm. c. Write down the correlation coefficient. d. State which two of the following describe the correlation between the variables: strong, zero, positive, negative, no correlation, weak 6. Bag A contains three white balls and four red balls. Two balls are chosen at random without replacement. a. (i) Complete the following tree diagram. (ii) Find the probability that two white balls are chosen. Bag A contains three white balls and four red balls. Two balls are chosen at random without replacement. Bag B contains four white balls and three red balls. When two balls are chosen at random without replacement from bag B, the probability that they are both white is . A standard die is rolled. If 1 or 2 is obtained, two balls are chosen without replacement from bag A, otherwise they are chosen from bag B. b. Find the probability that the two balls are white. c. Given that both balls are white, find the probability that they were chosen from bag A. 3 7. At a large school, students are required to learn at least one language, Spanish or French. It is known that of the students learn Spanish, and learn French. a. Find the percentage of students who learn both Spanish and French. b. Find the percentage of students who learn Spanish, but not French. c. At this school, of the students are girls, and of the girls learn Spanish. A student is chosen at random. Let G be the event that the student is a girl, and let S be the event that the student learns Spanish. (i) Find . (ii) Show that G and S are not independent. d. A boy is chosen at random. Find the probability that he learns Spanish. 8. A company produces a large number of water containers. Each container has two parts, a bottle and a cap. The bottles and caps are tested to check that they are not defective. A cap has a probability of 0.012 of being defective. A random sample of 10 caps is selected for inspection. a. Find the probability that exactly one cap in the sample will be defective. b. The sample of caps passes inspection if at most one cap is defective. Find the probability that the sample passes inspection. c. The heights of the bottles are normally distributed with a mean of of and a standard deviation . (i) Complete the following diagram, shading the region representing where the heights are less than . (ii) Find the probability that the height of a bottle is less than d. . (i) A bottle is accepted if its height lies between and . Find the probability that a bottle selected at random is accepted. (ii) A sample of 10 bottles passes inspection if all of the bottles in the sample are accepted. Find the probability that the sample passes inspection. e. The bottles and caps are manufactured separately. A sample of 10 bottles and a sample of 10 caps are randomly selected for testing. Find the probability that both samples pass inspection. Printed for East Mecklenburg High School © International Baccalaureate Organization 2015 4
