Teaching Phase: Teacher Worksheet
advertisement
TEACHING PHASE – TEACHER COPY
FUNTIONS: DOMAIN AND RANGE
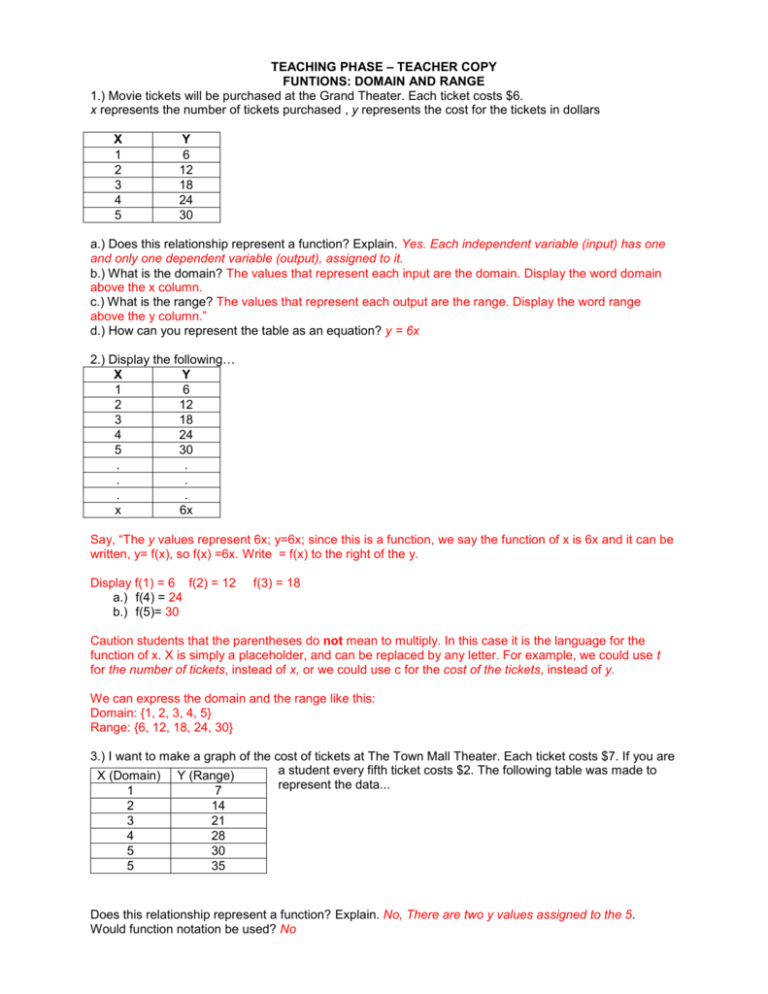
1.) Movie tickets will be purchased at the Grand Theater. Each ticket costs $6.
x represents the number of tickets purchased , y represents the cost for the tickets in dollars
X
1
2
3
4
5
Y
6
12
18
24
30
a.) Does this relationship represent a function? Explain. Yes. Each independent variable (input) has one
and only one dependent variable (output), assigned to it.
b.) What is the domain? The values that represent each input are the domain. Display the word domain
above the x column.
c.) What is the range? The values that represent each output are the range. Display the word range
above the y column.”
d.) How can you represent the table as an equation? y = 6x
2.) Display the following…
X
Y
1
6
2
12
3
18
4
24
5
30
.
.
.
.
.
.
x
6x
Say, “The y values represent 6x; y=6x; since this is a function, we say the function of x is 6x and it can be
written, y= f(x), so f(x) =6x. Write = f(x) to the right of the y.
Display f(1) = 6 f(2) = 12
a.) f(4) = 24
b.) f(5)= 30
f(3) = 18
Caution students that the parentheses do not mean to multiply. In this case it is the language for the
function of x. X is simply a placeholder, and can be replaced by any letter. For example, we could use t
for the number of tickets, instead of x, or we could use c for the cost of the tickets, instead of y.
We can express the domain and the range like this:
Domain: {1, 2, 3, 4, 5}
Range: {6, 12, 18, 24, 30}
3.) I want to make a graph of the cost of tickets at The Town Mall Theater. Each ticket costs $7. If you are
a student every fifth ticket costs $2. The following table was made to
X (Domain) Y (Range)
represent the data...
1
7
2
3
4
5
5
14
21
28
30
35
Does this relationship represent a function? Explain. No, There are two y values assigned to the 5.
Would function notation be used? No
4.) Once, I had surgery and had to stay home for 10 days. I made a graph of the total number of movies I
had watched during the 10 days.
Number of Movies I Saw
6y
5
4
3
2
1
0
x
0
2
4
6
8
10
12
Time (Days)
Make a table of values from the graph.
Time (days)
x
Number of
Movies I saw
y
2
4
6
8
10
1
2
3
4
5
What are the ordered pairs for this relationship? (2, 1), (4,2), (6, 3), (8, 4), (10,5)
Does the relationship graphed above represent a function? Yes Explain.
What is the equation? y = 0.5x
How would this be written using function notation? f(x) = 0.5x
What is the domain? {2,4,6,8,10}
What is the range?
{1,2,3,4,5}
f(2) = ?
f(2) = 1
f(10) = ?
f(10) = 5
http://staff.argyll.epsb.ca/jreed/math9/strand4/4102.htm
For the graph above:
What is the domain? The numbers from 0 to 5
What is the range? The numbers from 50 to 100
This is a continuous graph.
