File - Tonka Kinematics
advertisement
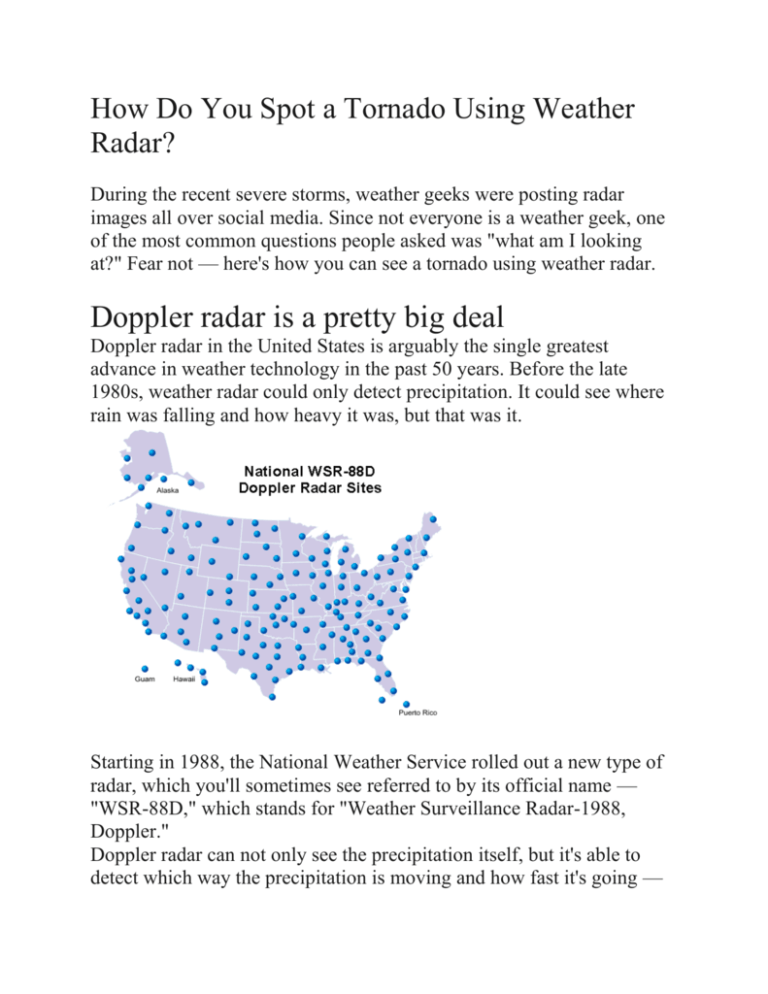
How Do You Spot a Tornado Using Weather Radar? During the recent severe storms, weather geeks were posting radar images all over social media. Since not everyone is a weather geek, one of the most common questions people asked was "what am I looking at?" Fear not — here's how you can see a tornado using weather radar. Doppler radar is a pretty big deal Doppler radar in the United States is arguably the single greatest advance in weather technology in the past 50 years. Before the late 1980s, weather radar could only detect precipitation. It could see where rain was falling and how heavy it was, but that was it. Starting in 1988, the National Weather Service rolled out a new type of radar, which you'll sometimes see referred to by its official name — "WSR-88D," which stands for "Weather Surveillance Radar-1988, Doppler." Doppler radar can not only see the precipitation itself, but it's able to detect which way the precipitation is moving and how fast it's going — essentially, it can detect both precipitation and wind. The product that shows winds is called "base velocity," since it's really measuring the velocity of the rain and hail inside the storm. The ability to see the winds inside of a thunderstorm is a huge deal. Meteorologists used to issue tornado warnings almost solely when someone spotted one on the ground and reported it, or when the thunderstorms on radar had the classic "hook" that possibly indicated the presence of a strong tornado. When they gained the ability to see the winds rotating within a thunderstorm, it greatly increased tornado warning lead times, saving countless lives over the past few decades. The hook brings you back... The vast majority of tornadoes that touch down in the United States don't come with the (in)famous hook echo that people are familiar with. Most tornadoes are relatively weak and short-lived, and you'd never know they were there if you were looking at a regular radar image showing precipitation. Here's an example of a rather tiny supercell with a classic hook as it dragged a large, wedge tornado through midtown Mobile, Alabama on Christmas Day 2012. Looking at the radar leaves little doubt that the storm is rotating and likely producing a tornado. On the other hand, take this image from south-central Mississippi back on April 7 of this year. At the time this image was captured, there was a tornado just as strong but three times larger (1/3 of a mile wide) tearing through a few small farm communities. Can you spot it? No? There's a good reason for that. You can't. The tornado is completely wrapped in rain so it looks no different from its surroundings on the precipitation image. If this had occurred in 1982 instead of 2014, meteorologists never would have issued a tornado warning unless someone called to report spotting it. Here's the same view, but with the base velocity image telling us what the winds are doing inside of the thunderstorms. Even if you don't know exactly what you're looking at, it's clear that there's something abnormal going on towards the center of the image. That's where the tornado was located, and this base velocity image is just screaming out "rotation!" when there was nary a blip on the reflectivity (precipitation) image. The colors tell the story Base velocity shows winds that are moving either towards or away from the radar site. For most outlets that publish/display radar imagery, red colors show winds moving away from the radar, while green colors show winds moving towards the radar. Darker shading indicates slower winds, while brighter colors indicate faster winds. The base velocity product is usually measured in knots, but in my radar software I've added code to convert it the imagery to MPH, so that's the scale used in the images in this post. Couplets It can be tricky to figure out where the radar site is most of the time, but you don't need to worry too much. When you're looking at the radar to spot a tornado, you want to look for couplets. A couplet is when red and green colors show up side-by-side within a thunderstorm on the base velocity image. When couplets are large and relatively weak, it's indicative of broad rotation within a thunderstorm that needs to be watched but may not show a tornado on the ground. When the couplet is tight and bright, it shows strong rotation within a thunderstorm that could produce (or is producing) a tornado. This is an example of the couplet produced by the tornado in Mississippi that I used as an example above. You can see that the red and green colors are very close together and relatively bright, showing strong rotation within the thunderstorm. Rotation on radar widely varies from storm to storm. Sometimes a tornado is so small or happens so quickly that the radar can't or doesn't have time to detect it. This is especially true of tornadoes that occur in landfalling tropical systems, squall lines, and storms very far away from the radar site. Larger tornadoes are a different story. This is a side-by-side view of precipitation (left) and winds (right) of a 600-yard wide EF-3 tornado as it moved through Lincoln County, Tennessee during the tornado outbreak last week. The supercell has the classic hook echo in the precipitation image to the left, and the winds on the base velocity image to the right shows a very well defined circulation with intense winds wrapping into the tornado. Even though the image is static, the couplet is so intense that you can almost see it spinning. Dual-Polarization The latest advance in weather radar technology is the relatively new "dual-polarization" — called dual-pol for short — that the NWS just finished installing across the country. In addition to seeing where and how fast precipitation is moving, dualpol technology allows us to see the size and shape of the objects off of which the radar beam is bouncing back to the radar site. This proves incredibly useful for spotting tornadoes. One of the dual-pol products that helps meteorologists detect the presence of a tornado is called the "correlation coefficient," or CC for short. CC tells you how similar the objects in a certain area are to one another, on a scale from 0% to 100%. Values close to 100% mean that everything in the area is uniform — all of the precipitation is the same size and the same shape, indicating that it's likely all rain. Lower CC values indicate that the beam is bouncing off of objects that widely vary in size and shape. If you have a small area of very low CC values within the strong rotation showing up on the base velocity images discussed above, there's a good chance that you're looking at the radar beam reflecting off of debris swirling around inside of a tornado. In general, warmer colors indicate higher CC values (more similar in size/shape) and cooler colors indicate lower CC values (less similar in size/shape). Dual-pol technology was used to confirm the presence of the Mississippi tornado that I've used as an example throughout this post. The embedded Tweet above shows the CC image for the EF-4 tornado that struck Tupelo, Mississippi on April 28, 2014. The dark ball towards the center of the image is the low CC values showing the debris in the air. A huge note of caution... Now that you (hopefully) know what to look for on weather radar when there are tornadoes somewhere in the country, do not look for a tornado on radar if you go under a tornado warning. Meteorologists issue tornado warnings for a good reason — if you're under one, you're in danger. This information is mainly to help you understand what you're looking at when there's dangerous weather far enough away from your location that you're not in any danger.

