Precalculus Polar Graphing “Mini-Project” Name At this point, you
advertisement
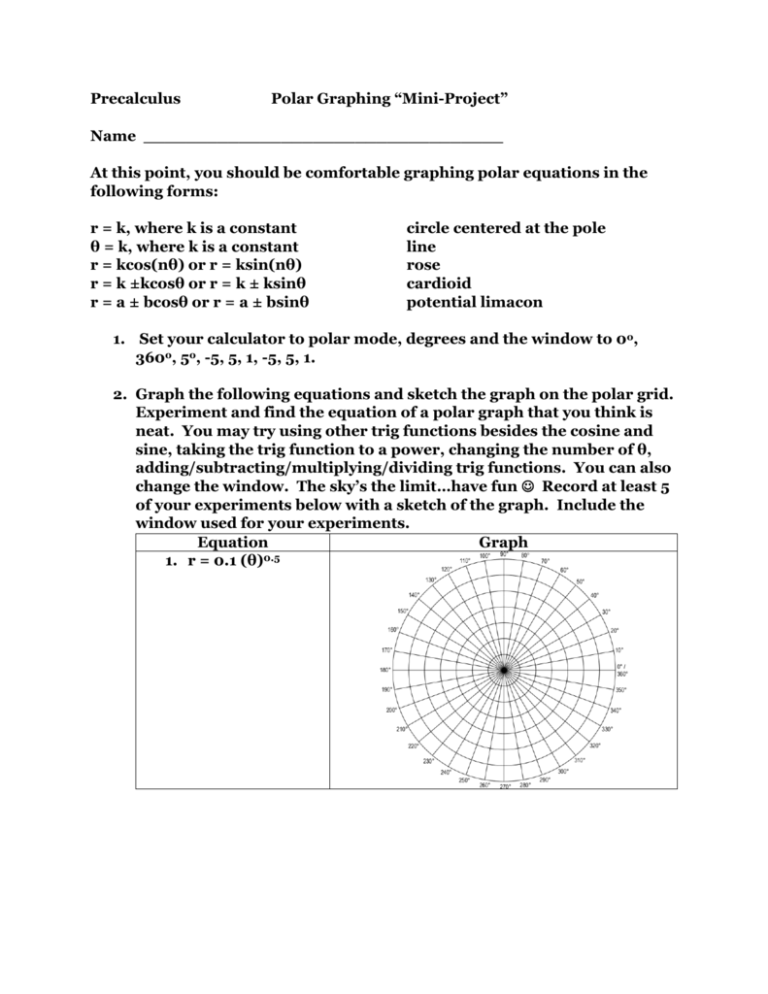
Precalculus Polar Graphing “Mini-Project” Name __________________________________ At this point, you should be comfortable graphing polar equations in the following forms: r = k, where k is a constant θ = k, where k is a constant r = kcos(nθ) or r = ksin(nθ) r = k ±kcosθ or r = k ± ksinθ r = a ± bcosθ or r = a ± bsinθ circle centered at the pole line rose cardioid potential limacon 1. Set your calculator to polar mode, degrees and the window to 0o, 360o, 5o, -5, 5, 1, -5, 5, 1. 2. Graph the following equations and sketch the graph on the polar grid. Experiment and find the equation of a polar graph that you think is neat. You may try using other trig functions besides the cosine and sine, taking the trig function to a power, changing the number of θ, adding/subtracting/multiplying/dividing trig functions. You can also change the window. The sky’s the limit…have fun Record at least 5 of your experiments below with a sketch of the graph. Include the window used for your experiments. Equation Graph 1. r = 0.1 (θ)0.5 2. r = -0.1(θ)0.5 3. r = (sin(θ))/(cos(θ))2 4. r = 1+.1sin(10θ) (Change window so that x and y go from -2 to 2 by .5) 5. r = 1+4cos(5θ) 6. 7. 8. 9. 10. 3. Create a design depicting a recognizable object (as opposed to an abstract design), i.e. snowflake, spider, hibiscus flower, bear’s face, etc. Choose a creative title for your design. Use a SINGLE polar equation as the basis for your design. You may choose to embellish the background with other shapes, but the polar graph must be the focal point of the design. Complete the table of values for your equation, and plot each of the points by hand on the included polar grid. Fill the polar grid as much as possible (which means you may need to change the scale on the grid). Your design should exhibit originality, complexity, and creativity. A simple rose curve, for example, is not a complex design, nor is a flower highly creative or original. Experiment! Lastly, connect your calculator to Mrs. Siebert’s computer, and print your graph. Write the window used on the printout. Title: ______________________________________ r Θ (degrees) 0 15 30 45 60 75 90 105 120 135 150 165 r Θ (degrees) 180 195 210 225 240 255 270 285 300 315 330 360 Name: ___________________________________ Grading Rubric: 1. The five given graphs are sketched correctly. 0 1 2 3 4 5 2. Five experimental graphs are included and are varied and correct. 0 1 2 3 4 5 3. Final design depicts a recognizable object. Title is creative and is appropriate for the design. 0 1 2 3 4 5 4. A single polar equation is used as the basis for the design. Design fills most of the graph. 0 1 2 3 4 5 5. Table of values is complete and correct. 0 1 2 3 4 5 6. Equation is correctly graphed (and points from table correctly plotted). 0 1 2 3 4 5 7. Calculator printout includes window used. 0 1 2 3 4 5 TOTAL: _____ / 35
