P9.1 Post Teacher aug12
advertisement

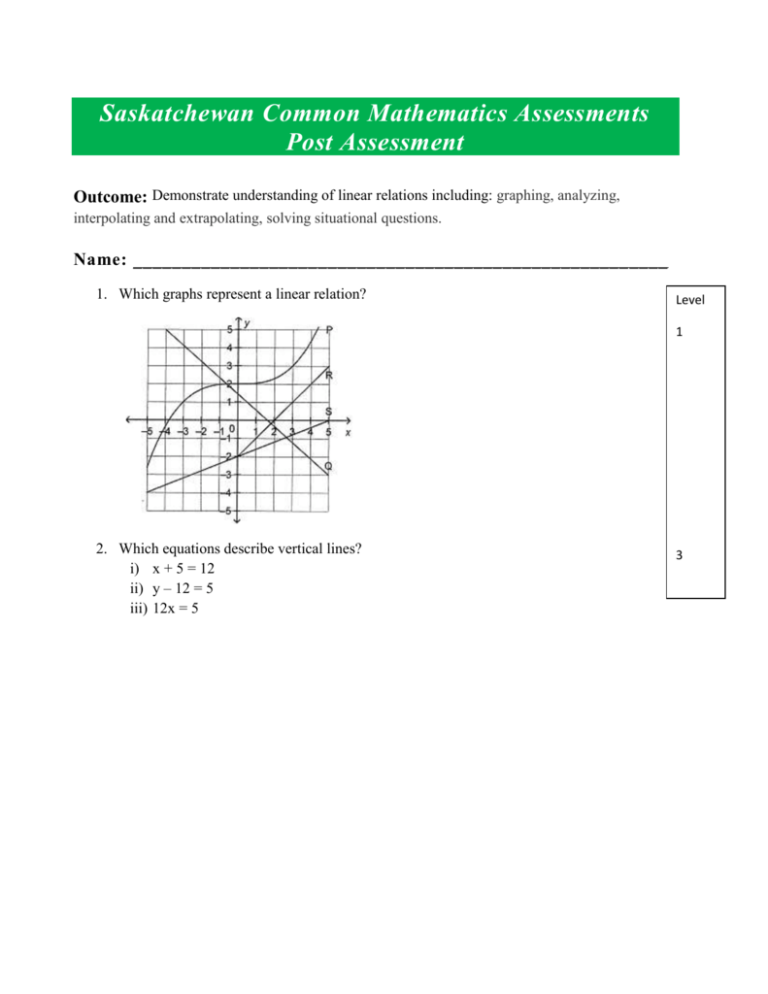
Saskatchewan Common Mathematics Assessments Post Assessment Outcome: Demonstrate understanding of linear relations including: graphing, analyzing, interpolating and extrapolating, solving situational questions. Name: _______________________________________________________ 1. Which graphs represent a linear relation? Level 1 2. Which equations describe vertical lines? i) x + 5 = 12 ii) y – 12 = 5 iii) 12x = 5 3 3. Which equation describes the graph below? 1 i) y = x + 1 2 1 ii) y = x – 1 2 iii) y = -2x – 1 iv) y = 2x – 1 4. Graph the following lines on the same grid. What shape do they form? i) y = x ii) x – 8 = 0 iii) y – 4 = 0 Level 3 4 5. This graph shows how a speed in feet per second relates to a speed in metres per second. Estimate the speed in metres per second of an object moving at 26 ft/s. Level 6. This graph shows the gas consumption rate of a car. Estimate the distance the car can travel on 60L of gas. 2 1 7. Create a table of values for the relation y = 1.5x + 3, then graph the relation. Use 0, 2, 4, 6, 8, 10 as values of x. Level 3 a) b) c) Is the relation linear? How do you know? d) What is the value of y when x = 33? 8. A helicopter is at a height of 1600m when it starts descending to land. The helicopter’s height changes at an average rate of 140m/min. a) Write an equation that relates the height of the helicopter, H metres, to the time since the helicopter began its descent, t minutes. b) What is the height of the helicopter 9 min after it began its descent? 2 4 Teacher Section Teacher Notes: Materials needed: graph paper, ruler, calculator Question Indicator Level Answer Key: 1 2 3 4 P9.1 b P9.1 d P9.1 f P9.1 c 1 3 3 4 Q,R,S I 7 iii Ii The lines intersect to form a right triangle. 5 6 7a P9.1 a P9.1 e P9.1 h 1 2 3 8m/s Approximately 540 km 7b P9.1 c, i 3 7c P9.1 d 2 7d 8a 8b P9.1 h P9.1 i P9.1 i 3 4 4 Answer The relation is linear because the points on the graph lie on a straight line. There is also a pattern formed in the table of values. y = 52.5 H = 1600 + 140s 340 m Outcome: P9.1 Demonstrate understanding of linear relations including: graphing, analyzing, interpolating and extrapolating and solving situational questions. up to Level 1 up to Level 2 up to Level 3 up to Level 4 Description of Levels: (based on Marzano, 2007) There is a partial understanding of some of the simpler details and processes. Prior knowledge is understood. P8.1 g or other indicator Indicators and Learning Targets for each Level: Studentfriendly descriptions of learning targets. No major errors or omissions regarding the simpler details or processes, but major errors or omissions regarding the complex processes may be present. No major errors or omissions regarding any of the information and/or processes that were explicitly taught. This is the target level for proficiency. (a) Observe and describe a situation relevant to self, family, or community that a given graph might represent and explain the meaning conveyed by the graph. (b) Sort a set of graphs into representations of linear and non-linear relations. (d) Generalize strategies for determining if a given linear relation will have a graph that is horizontal, vertical, increasing, or decreasing. (a) I can observe and describe a situation relevant to self, family, or community that a given graph might represent and explain the meaning shown by the graph. (b) I can sort a set of graphs into linear and non-linear relations. (d) I can generalize strategies for deciding if a given linear relation will have a graph that is horizontal, vertical, increasing, or decreasing. (c) Sketch graphs for given linear relations, including horizontal and vertical lines, with and without the use of technology. (e) Extrapolate to determine a value for either variable in a linear relation beyond the shown graph. (f) Verify an extrapolated value from a graph by using substitution in the related linear relation. (g) Interpolate to determine a value for either variable in a linear relation within the shown graph. (h) Verify an interpolated value from a graph by using substitution in the related linear relation. (i) Solve situational questions by graphing linear relations and interpreting the resulting graphs. (c) I can sketch graphs for given linear relations, including horizontal and vertical lines, with and without the use of technology. (e) I can draw conclusions to determine a value for either variable in a linear relation beyond the shown graph. (f) I can confirm an inferred value from a graph by using substitution in the linked linear relation. (g) I can interpolate to determine a value for either variable in a linear relation within the shown graph. (h) I can verify an interpolated value from a graph by using substitution in the related linear relation. (i) I can solve situational questions by graphing linear relations and interpreting the resulting graphs. In addition to level 3 performance, indepth inferences and applications go beyond what was explicitly taught. Construct a linear relationship based upon data


