Volumetric Glassware Calibration: Lab Experiment Guide
advertisement
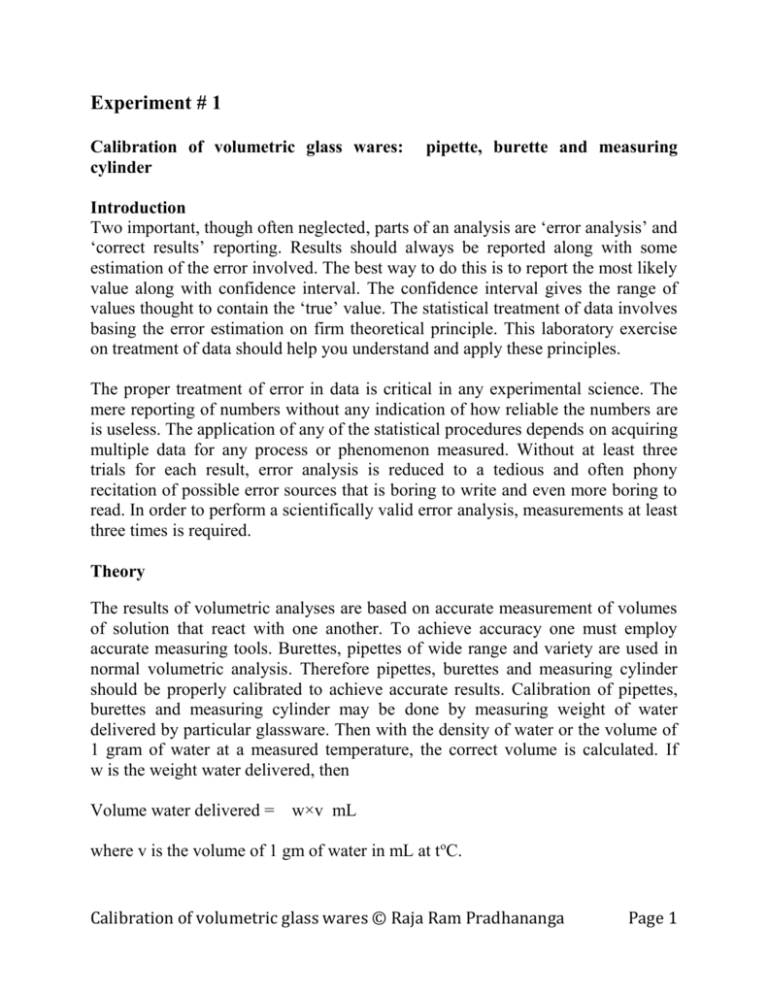
Experiment # 1 Calibration of volumetric glass wares: cylinder pipette, burette and measuring Introduction Two important, though often neglected, parts of an analysis are ‘error analysis’ and ‘correct results’ reporting. Results should always be reported along with some estimation of the error involved. The best way to do this is to report the most likely value along with confidence interval. The confidence interval gives the range of values thought to contain the ‘true’ value. The statistical treatment of data involves basing the error estimation on firm theoretical principle. This laboratory exercise on treatment of data should help you understand and apply these principles. The proper treatment of error in data is critical in any experimental science. The mere reporting of numbers without any indication of how reliable the numbers are is useless. The application of any of the statistical procedures depends on acquiring multiple data for any process or phenomenon measured. Without at least three trials for each result, error analysis is reduced to a tedious and often phony recitation of possible error sources that is boring to write and even more boring to read. In order to perform a scientifically valid error analysis, measurements at least three times is required. Theory The results of volumetric analyses are based on accurate measurement of volumes of solution that react with one another. To achieve accuracy one must employ accurate measuring tools. Burettes, pipettes of wide range and variety are used in normal volumetric analysis. Therefore pipettes, burettes and measuring cylinder should be properly calibrated to achieve accurate results. Calibration of pipettes, burettes and measuring cylinder may be done by measuring weight of water delivered by particular glassware. Then with the density of water or the volume of 1 gram of water at a measured temperature, the correct volume is calculated. If w is the weight water delivered, then Volume water delivered = w×v mL where v is the volume of 1 gm of water in mL at toC. Calibration of volumetric glass wares © Raja Ram Pradhananga Page 1 Mean of finite number of measurements x1,x2 -------------xn is obtained by averaging the individual results ∑𝑖=𝑛 𝑥 𝑥 + 𝑥2 + − − − − − − + 𝑥𝑛 𝑥̅ = 𝑖=𝑜 𝑖 = 1 𝑛 𝑛 where x1, x2 etc. are individual results and n is number of observations and 𝑥̅ is the mean. Error is numerical difference between a measured value and true value. Accuracy is the extent to which the average value of series of measurements differs from the true value. That means accuracy is closeness with which the test result cluster round the true value. The smaller the error, the greater is the accuracy. The accuracy as relative error is calculated as: Absolute error | Measured value – True value | Relative error = -------------------- x 100 % = -------------------------------- x 100 % True value True value The true value is never known to the degree of 100% accuracy. Accurate results are assumed to be those measured value which have been determined by skilled experimentalists using best quality instruments. The accuracy can be measured quantitatively with the help of the standard deviation, the deviation of the results being calculated from true value not from the average. The smaller the standard deviations the higher is the accuracy. Precision is the extent to which the repeat measurements repeat its results. That means precision is the closeness with which the repeat measurements cluster around the average value. Precision does not by any means imply accuracy – it is used to describe the reproducibility of the results. The precision is quantitatively measured with the help of standard deviation. The standard deviation is calculated from the arithmetic mean of observed values. The smaller the standard deviation, the higher is the precision. The standard deviation is a root mean square deviation of values from their average and calculated using the equations ∑i=n (xi -x̅)2 s = √ i=0 n-1 Confidence interval is the termed used to define the numerical interval on either side of the mean within which the true mean can be expected to lie with a given probability. It is calculated by the formula, Calibration of volumetric glass wares © Raja Ram Pradhananga Page 2 Here s is the standard deviation, 𝑥̅ is the mean, n is the number of observations and t is the statistical factor. The value of t is obtained from a table at a given probability level and a given degree of freedom. For a five observations (i-e for a 4 degree of freedom at 95% confidence level), the value of t is 2.776. Apparatus One 25 mL volumetric pipette, one 50 mL burette, one 50 mL measuring cylinder and two 50 mL beakers Chemicals 200 mL distilled water Procedure (a) Cleanliness check: Fill the pipette to slightly above the mark. Place the tip against the side of a beaker and let the pipette drain until empty. Examine the inner surface of the pipette to ensure it is clean (any water droplets indicate that the pipette walls are contaminated). If necessary, clean the pipette or obtain another one. (b) Dispensing time: Fill the pipette to the mark. The bottom of the meniscus should touch the top of the graduated mark. The adjustment should be made with your eye at the same level as the graduation mark. Measure the time required to deliver the definite volume of the water from volumetric pipette, with the tip touching inside of a beaker. Note this time in your laboratory note book. Calibration of a Pipette 1. Weigh a clean and dry 50 mL beaker on a top loading balancing to 1 mg and record the weight. (Once you pick a balance, use the same one for all weighing) 2. Fill the pipette to above the mark and remove any water adhering to the outside of the pipette. 3. Place the tip of the pipette in contact with the inside of beaker and slowly lower the meniscus to the mark. Do not remove any more water from outside of the pipette. Calibration of volumetric glass wares © Raja Ram Pradhananga Page 3 4. Touch the top to the side of the weighed beaker and dispense the water until holding the pipette vertically. 5. After the water has ceased flowing, wait 2 seconds, and then remove the pipette from the container. 6. Reweigh the beaker, and calculate the weight of water in beaker. Record the water temperature in your laboratory note-book. 7. Repeat the procedure until you have 5 separate measurements for the same pipette. Calibration of Burette Take 50mL burette for this experiment. Carry out the experiment following the procedure similar to the calibration of pipette. For gravimetric calibration drain 25mL of water from the burette and determine the weight. Repeat the measurement until you have 5 separate measurements. Analyze the data as given in the calibration of pipette. Calibration of Measuring Cylinder Take 50mL measuring cylinder for this experiment. For the gravimetric calibration, weigh 25mL of water transferred from the measuring cylinder. Repeat the measurement for five times. Analyze the data as given in the calibration of the pipette. Calibration of volumetric glass wares © Raja Ram Pradhananga Page 4 Results: Temperature oC Volume of 1 gram of water at oC = mL Calibration of pipette. Nominal volume of volumetric pipette = 25 mL First Second Third Fourth Fifth Beaker weight Total weight Weight of water Volume of water Mean volume = Relative error = Standard deviation = Confidence limit = at 95% confidence level Calibration of burette. Nominal Volume delivered by the burette = 25 mL First Second Third Fourth Fifth Beaker weight Total weight Weight of water Volume of water Mean volume = Relative error = Standard deviation = Confidence limit = at 95% confidence level Calibration of measuring cylinder.Volume deliv. by measuring cylinder=25 mL First Second Third Fourth Fifth Beaker weight Total weight Weight of water Volume of water Mean volume = Relative error = Standard déviation = Confidence limit = at 95% confidence level Conclusion: Calibration of volumetric glass wares © Raja Ram Pradhananga Page 5 Appendix Volume of 1 g of water at different temperature Temp, oC Vol, mL 16 18 20 1.0021 1.0023 1.0027 22 24 26 28 1.0033 1.0037 1.0044 1.0047 30 1.0053 Value of “t” at 95% confidence level at different degree of freedom Deg. of 1 2 3 reedom Value of t 12.706 4.303 3.182 4 5 6 7 8 9 2.776 2.571 2.447 2.365 2.306 2.306 Calibration of volumetric glass wares © Raja Ram Pradhananga Page 6
