Splitting of the characteristic
Kα doublet radiation of iron
TEP
5.4.08
-01
Related topics
Characteristic X-radiation, energy levels, selection rules for X-radiation, energy term symbols, and
Bragg’s law
Principle
The X-radiation that is generated by an X-ray tube with an iron anode is selected as a function of the
Bragg angle with the aid of a monocrystal. A Geiger-Müller counter tube registers the intensity of the radiation. The separation of the lines of the Kα doublet as well as their respective intensities are determined.
Equipment
1
1
1
1
1
1
1
1
XR 4.0 expert unit
X-ray goniometer
X-ray plug-in unit with a Fe X-ray tube
Counter tube, type B
X-ray lithium fluoride crystal, mounted in a holder
X-ray diaphragm tube, 2 mm
measure XRm 4.0 X-ray software
Data cable USB, plug type A/B
09057-99
09057-10
09057-70
09005-00
09056-05
09057-02
14414-61
14608-00
Additional equipment
PC, Windows® XP or higher
This experiment is included in the “XRC 4.0 X-ray characteristics” upgrade set.
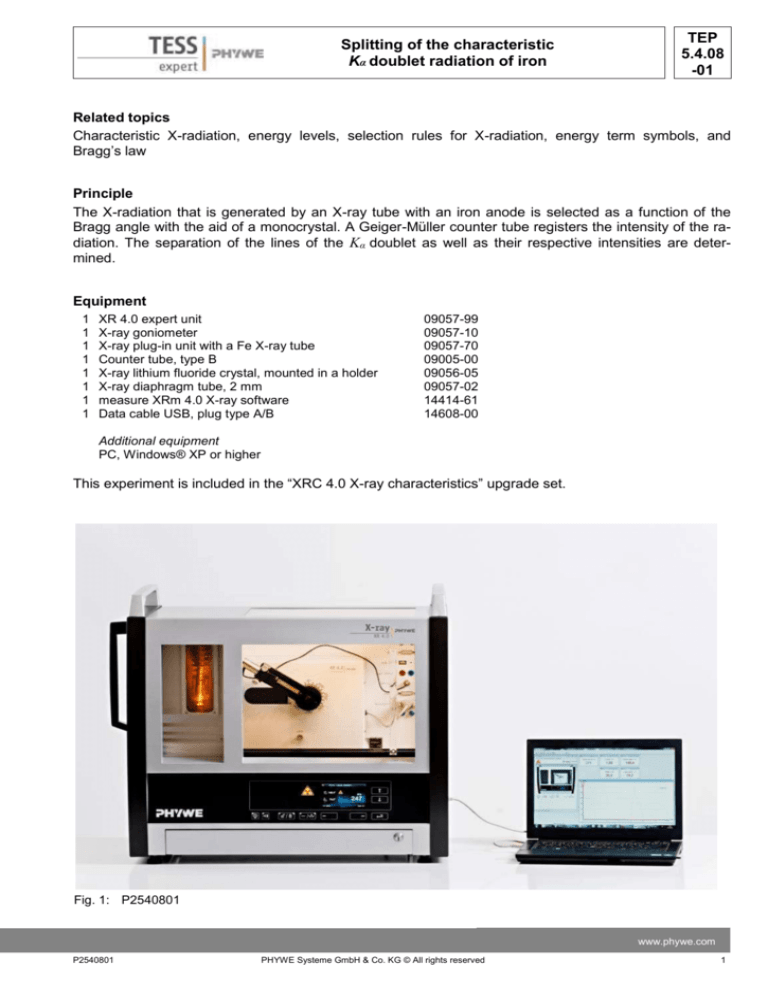
Fig. 1: P2540801
www.phywe.com
P2540801
PHYWE Systeme GmbH & Co. KG © All rights reserved
1
TEP
5.4.08
-01
Splitting of the characteristics
Kα doublet radiation of iron
Tasks
1. Analyse the intensity of the iron X-radiation as a function of
the Bragg angle and with the aid of a LiF monocrystal.
2. Determine the wavelengths and intensities of the Kα1 and Kα2
lines and compare your values to the theoretical values.
Set-up
Connect the goniometer and the Geiger-Müller counter tube to
their respective sockets in the experiment chamber (see the red
markings in Fig. 2). The goniometer block with the analyser crystal should be located at the end position on the right-hand side.
Fasten the Geiger-Müller counter tube with its holder to the back
stop of the guide rails. Do not forget to install the diaphragm in
front of the counter tube (see Fig. 3).
Insert a diaphragm tube with a diameter of 2 mm into the beam
outlet of the tube plug-in unit for the collimation of the X-ray
beam.
For calibration: Make sure, that the correct crystal is entered in Fig. 2: Connectors in the experiment
the goniometer parameters. Then, select “Menu”, “Goniometer”, chamber
“Autocalibration”. The device now determines the optimal positions of the crystal and the goniometer to each other and then
the positions of the peaks.
GM-counter
tube
Goniometer at
the end position
Diaphragm tube
Counter tube
diaphragm
Mounted
crystal
Fig. 3: Set-up of the goniometer
2
PHYWE Systeme GmbH & Co. KG © All rights reserved
P2540801
TEP
5.4.08
-01
Splitting of the characteristic
Kα doublet radiation of iron
Note
Details concerning the operation of the X-ray unit
and goniometer as well as information on how to
handle the monocrystals can be found in the respective operating instructions.
Procedure
Fig. 4: Connection of the computer
- Connect the X-ray unit via USB cable to the
USB port of your computer (the correct port of
the X-ray unit is marked in Fig. 4).
- Start the “measure” program. A virtual X-ray unit
will be displayed on the screen.
- You can control the X-ray unit by clicking the
various features on and under the virtual X-ray
unit. Alternatively, you can also change the parameters at the real X-ray unit. The program will
automatically adopt the settings.
- Click the experiment chamber to change the parameters for the experiment. In the case of the
entire spectrum, select the settings as shown in
Figure 6. If you measure the section of the Kα1
and Kα2 lines, select the following scanning
range: start angle 70°, stop angle 77°, gate time
For setting the
For setting the
of 3 s.
X-ray tube
goniometer
- If you click the X-ray tube, you can change the
voltage and current of the X-ray tube. Select the
parameters as shown in Figure 7.
- Start the measurement by clicking the red circle
Fig. 5: Part of the user interface of the software
-
-
-
After the measurement, the following window
appears:
Select the first item and confirm by clicking
OK. The measured values will now be transferred directly to the “measure” software.
At the end of this manual a short introduction
to the evaluation of the resulting spectra is
given.
Overview of the settings of the goniometer and
X-ray unit:
- 2:1 coupling mode
- Angle step width 0.1°
- Anode voltage UA = 35 kV; anode current
IA = 1 mA
Recording of the entire spectrum:
- Gate time 2 s
- Scanning range 4°-80°
Kα1 and Kα2 lines:
- Gate time 3s
Note
- Scanning range 70°-77°
Never expose the Geiger-Müller counter tube to
the primary X-radiation for an extended period of time.
www.phywe.com
P2540801
PHYWE Systeme GmbH & Co. KG © All rights reserved
3
TEP
5.4.08
-01
Splitting of the characteristics
Kα doublet radiation of iron
Fig 6: Goniometer settings; task 1
Fig 7: Voltage and current settings
Theory
Figure 8 shows the energy-level-diagram of iron (Z = 26). When an electron is removed from the K shell
of an atom, the resulting hole is filled by an electron from a higher shell. The energy difference of the energy levels that are involved in this process can be converted into X-radiation. When an s electron is
missing from the K shell, an 2S1/2 term results. The same applies to the L1 shell. A missing p electron on
the L2 or L3 shell results in 2P1/2 -3/2 or 2P3/2 terms. Since quantum-mechanical selection rules only allow
radiative transitions with Δl = ±1, the transition L1→K is not allowed. Indeed, instead of three Kα lines,
only the two lines Kα1 and Kα2 can be observed. Since the conditions 2P3/2 and 2P1/2 are fourfold and twofold degenerate, the intensities of the Kα1 and Kα2 lines have the ratio 4:2.
With the aid of Bragg’s law (1), the glancing angles ϑ of the characteristic lines can be used to determine
their wavelengths:
2d sin n
(1)
Fig. 8: Energy-level-diagram of iron
4
PHYWE Systeme GmbH & Co. KG © All rights reserved
P2540801
TEP
5.4.08
-01
Splitting of the characteristic
Kα doublet radiation of iron
(d =interplanar spacing (d(LiF)=201.4 pm); n=1, 2, 3,…)
For comparison, the wavelengths can also be calculated from the energy-level-diagram in Figure 8 with
the aid of (2):
E h f
Planck’s constant
Velocity of light
Equivalent
hc
(2)
= 6.6256∙10-34 Js
= 2.9979∙108 m/s
= 1.6021∙10-19 J
h
c
1 eV
Note
The data of the energy-level diagram were taken from the "Handbook of Chemistry and Physics", CRC
Press Inc., Florida.
Evaluation
In the following section, the evaluation of the data is described based on example results. Your results
may differ from the results given below.
Task 1: Analyse the intensity of the iron X-radiation as a function of the Bragg angle and with the aid of a
LiF monocrystal.
Figure 9 shows the X-ray spectrum of iron that was analysed with a LiF monocrystal. The splitting of the
Kα doublet becomes just about visible as of the second-order interference (n = 2).
Table 1 shows the values of the glancing angles ϑ that were determined based on Figure 9 as well as
the values of the wavelengths λ of the characteristic X-ray line of iron that were calculated with the aid of
equation (1). For comparison, table 2 shows the λ values that were calculated with the aid of equation (2)
and based on the energy values of Figure 8.
Table 1: Wavelengths of the Kα and Kβ lines calculated with the aid of the experimental values
ϑ (Kα)/°
ϑ(Kβ)/°
λ(Kα)/pm
λ(Kβ)/pm
n=1
28.9
26.0
194.7
176.6
n=2
74.3
61.0
193.9
176.15
193.8
176.48
Mean value:
Table 2: Wavelengths of the Kα and Kβ lines calculated with the aid of the energy values (see Fig. 8)
λ(Kα1)/pm
λ(Kα2)/pm
λ(Kβ)/pm
193.6
193.99
175.66
www.phywe.com
P2540801
PHYWE Systeme GmbH & Co. KG © All rights reserved
5
TEP
5.4.08
-01
Splitting of the characteristics
Kα doublet radiation of iron
Fig. 9: X-ray spectrum of iron; LiF monocrystal as the analyser
Task 2: Determine the wavelengths and intensities of the Kα1 and Kα2 lines and compare your values to
the theoretical values.
In Figure 10, the line maxima are located at ϑ(Kα1) = 74.1° and ϑ(Kα2) = 74.5. Based on these glancing
angle values, equation (1) leads to the following values for the associated wavelengths:
λ(Kα1) = 193.70 pm and λ(Kα2) = 194.08 pm.
They correspond rather well to the values that were calculated based on the energy values of the energy-level-diagram in Figure 8 (see table 2). The difference of the two wavelengths of Δλ = 0.38 pm that
was determined by way of an experiment is also very close to the theoretical value of Δλ = 0.37 pm.
As a first approximation, the intensity of an X-ray line is determined by its maximum. As a result, Figure
10 leads to an intensity ratio of I(Kα1)/I(Kα2)≈1.9.
Fig. 10: Splitting of the Kα1 and Kα2 lines of iron (n=2)
6
PHYWE Systeme GmbH & Co. KG © All rights reserved
P2540801
Splitting of the characteristic
Kα doublet radiation of iron
“measure” software
With the “measure” software, the peaks in the spectrum can be determined rather easily:
-
-
-
Click the button
nation.
and select the area for the peak determi-
TEP
5.4.08
-01
Refer to the Help of the
“measure” software for additional, more detailed explanations concerning the program
features.
Click the button
“Peak analysis”.
The window “Peak analysis” appears (see Fig. 12).
Then, click “Calculate”.
If not all of the desired peaks (or too many of them) are calculated, readjust the error tolerance accordingly.
Select “Visualise results” in order to display the peak data directly in the spectrum.
Fig. 12: Automatic peak analysis with “measure”
www.phywe.com
P2540801
PHYWE Systeme GmbH & Co. KG © All rights reserved
7
TEP
5.4.08
-01
8
Splitting of the characteristics
Kα doublet radiation of iron
PHYWE Systeme GmbH & Co. KG © All rights reserved
P2540801

