Exponential Relationships Practice Problems Answer Key
advertisement
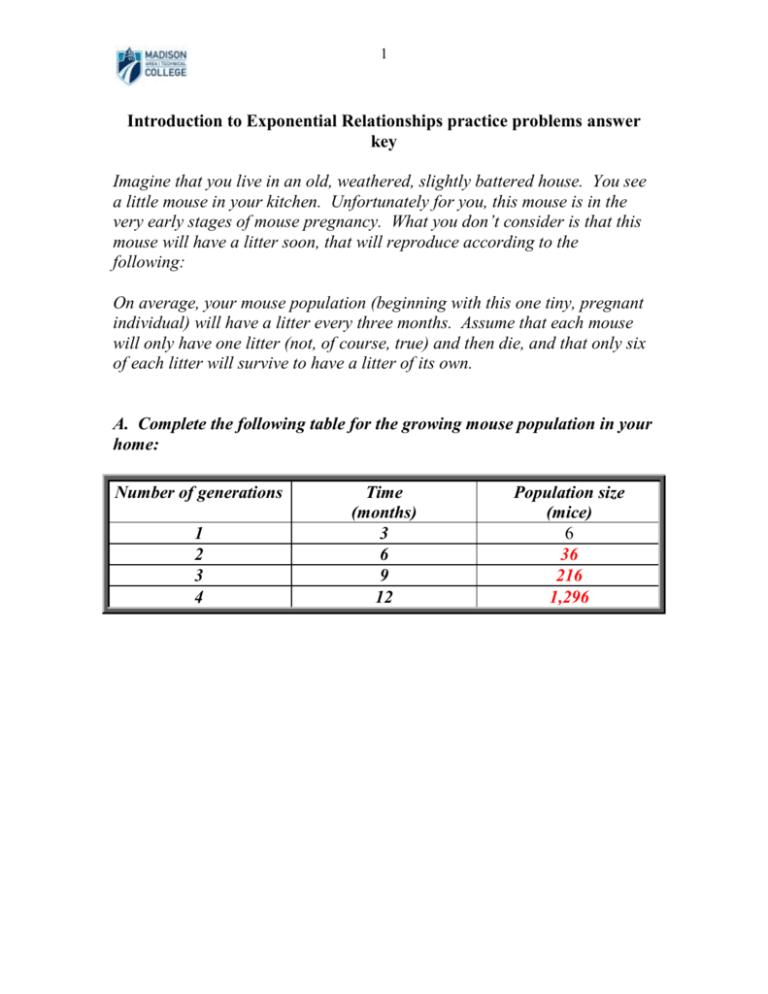
1 Introduction to Exponential Relationships practice problems answer key Imagine that you live in an old, weathered, slightly battered house. You see a little mouse in your kitchen. Unfortunately for you, this mouse is in the very early stages of mouse pregnancy. What you don’t consider is that this mouse will have a litter soon, that will reproduce according to the following: On average, your mouse population (beginning with this one tiny, pregnant individual) will have a litter every three months. Assume that each mouse will only have one litter (not, of course, true) and then die, and that only six of each litter will survive to have a litter of its own. A. Complete the following table for the growing mouse population in your home: Number of generations 1 2 3 4 Time (months) 3 6 9 12 Population size (mice) 6 36 216 1,296 2 B. Plot this population growth on the graph paper provided (as best you can!) This is what exponential relationships look like. How easy is it for you to predict your population size in 15 months from this graph? Not very easy Why? Because the curve rises so steeply C. Now, take the log of each of your population numbers and fill in the table below. Number of generations Time (months) Population size (mice) 1 2 3 4 3 6 9 12 6 36 216 1,296 Log of population size 0.778 1.556 2.334 3.113 3 D. Plot the log of the population vs. months on the graph paper provided. How does the shape of this curve compare to the shape of the curve in B? It is linear, rather than rise steeply as a curve How easy is it for you to predict your population size in 15 months from this graph of log of population vs. months? Easy because it is linear Record your prediction: __________________ 4 E. Plot the population vs. months on the semi-log paper provided. How does the shape of this curve compare to the shape of the curves in B? In D? It is linear, and looks the same as in part D (the log of population vs. time) How easy is it for you to predict your population size in 15 months from this graph on semilog paper? Easy—read off the y-axis! Record your prediction: __________________ F. Write an equation for the population increase based on your data: N = N0*6t Where N is the number of mice after a given generation, “t”, and N0 is the starting number of mice.
