AMDM Name: Unit 3 Review: Statistical Studies Date: Class _____
advertisement
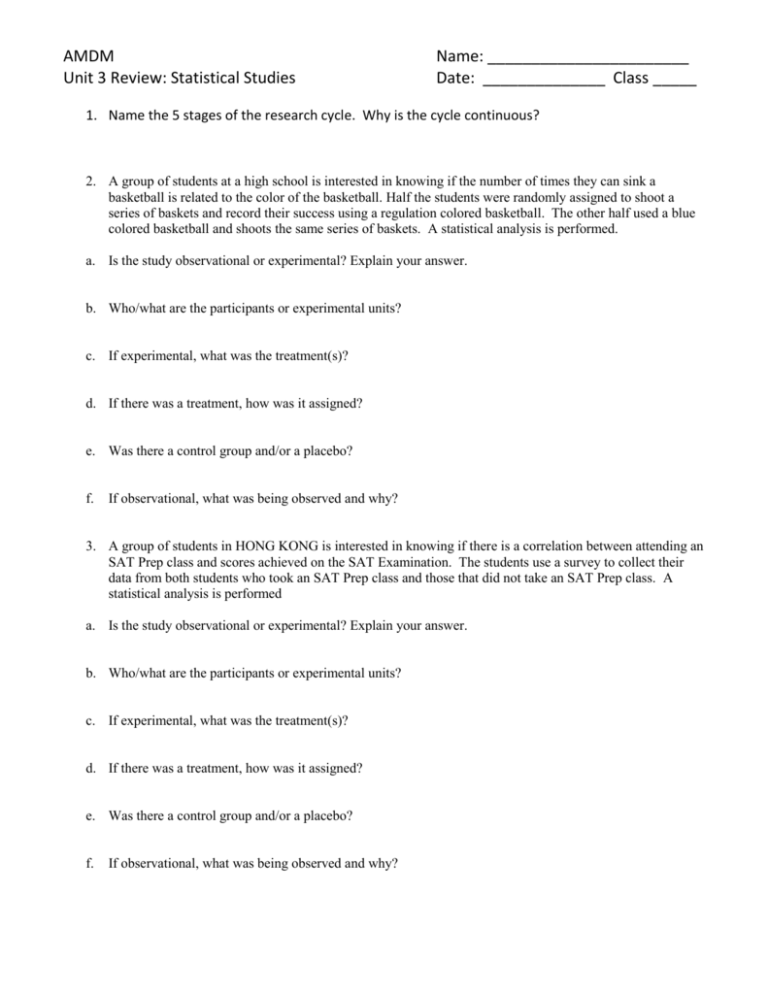
AMDM Unit 3 Review: Statistical Studies Name: _______________________ Date: ______________ Class _____ 1. Name the 5 stages of the research cycle. Why is the cycle continuous? 2. A group of students at a high school is interested in knowing if the number of times they can sink a basketball is related to the color of the basketball. Half the students were randomly assigned to shoot a series of baskets and record their success using a regulation colored basketball. The other half used a blue colored basketball and shoots the same series of baskets. A statistical analysis is performed. a. Is the study observational or experimental? Explain your answer. b. Who/what are the participants or experimental units? c. If experimental, what was the treatment(s)? d. If there was a treatment, how was it assigned? e. Was there a control group and/or a placebo? f. If observational, what was being observed and why? 3. A group of students in HONG KONG is interested in knowing if there is a correlation between attending an SAT Prep class and scores achieved on the SAT Examination. The students use a survey to collect their data from both students who took an SAT Prep class and those that did not take an SAT Prep class. A statistical analysis is performed a. Is the study observational or experimental? Explain your answer. b. Who/what are the participants or experimental units? c. If experimental, what was the treatment(s)? d. If there was a treatment, how was it assigned? e. Was there a control group and/or a placebo? f. If observational, what was being observed and why? AMDM Unit 3 Review: Statistical Studies Name: _______________________ Date: ______________ Class _____ 4. What type of sampling method is used in the following scenarios? Answer bank: Census, Cluster, Convenience, Simple, Stratified, Systematic a. Alejandro picked his survey participants based on the first five students he saw in each of his classes. b. Alyssa took lists of all freshmen, sophomore, juniors and seniors and then randomly selected 25 students from each list. c. Michael had all the students in the auditorium break into groups of six and number themselves one through six. Then he rolled a die to select which participant in each group would be surveyed. d. Ashley got a list of all the students in the school and used a random number generator to select the students to be surveyed. e. Stephanie separated all the students in the cafeteria into 30 groups of ten. Then she randomly selected five of the groups to be tested. All members of the five groups were tested. f. Joey could not figure out how to break the students into groups, so he just surveyed every single student in the school. 5. The following are the IQ scores of 7th graders 86, 90, 93, 95, 100, 100, 110, 111, 120, 123, 126, 89, 93, 97, 97, 110, 111, 110, 115, 118, 119, 120, 128, 130, 175, 98, 99, 105, 107, 107, 110, 110 a. Create a histogram (describe the shape, unusual features, gaps, are there any outliers) b. Find the mean, median, and IQR. 6. An article post results of a study that shows 24 3 percent of people in Atlanta are frustrated with traffic in the mornings. What does 24 3 percent mean? 7. The following are the scores of 12 members of a woman’s golf team in tournament play: 89 90 87 95 86 81 111 108 83 88 91 79 AMDM Unit 3 Review: Statistical Studies Name: _______________________ Date: ______________ Class _____ a. Find the five-number summary” for the data. b. Create a boxplot (box-and-whisker) below. Label and scale your axis. c. The lowest 25% of the scores are below what value? d. The middle 50% of the scores lie between what numbers? 8. A study was conducted to determine if bags of Spud Potato Chips actually contain 28.3 grams of chips. Random samples from around the state of Georgia were collected from several different grocery stores (Publix, Kroger, Wal-Mart, Targer Superstore, Piggly Wiggly, etc.). The chips from each bag were weighed. a. Observational or Experimental study? b. Suppose data were collected for 25 bags of Spud Potato Chips and the following weights were obtained: 25 29 23 26 28 25 25 24 24 27 23 24 28 27 24 26 24 25 27 26 25 26 24 25 25 c. Find the Mean, Median, and IQR. d. Find the 5 number summary for the data. e. Create a dot plot for the data. __________________________________________________________ f. Is the data skewed left/skewed right/normal? AMDM Unit 3 Review: Statistical Studies 9. Name: _______________________ Date: ______________ Class _____ A group of students were surveyed about the number of hours they spent studying in the last week. Study hours reported Number of Students 0 1 1 2 2 4 3 6 4 14 5 7 6 5 7 3 10 1 a. Make a Histogram for this data. b. Calculate the mean and median. c. Describe what you see from the histogram. 10. Describe the different Types of bias Sampling bias: ________________________________________________________________________ ________________________________________________________________________ ________________________________________________________________________ Undercoverage: ________________________________________________________________________ ________________________________________________________________________ ________________________________________________________________________ Nonresponse bias: ________________________________________________________________________ ________________________________________________________________________ ________________________________________________________________________ Response bias: _____________________________________________________________________________________________ _____________________________________________________________________________________________ _____________________________________________________________________________________________ Observer effect: ________________________________________________________________________ ________________________________________________________________________ ________________________________________________________________________ Wording of Questions: ________________________________________________________________________ ________________________________________________________________________ ________________________________________________________________________
