Explain the difference between one
advertisement
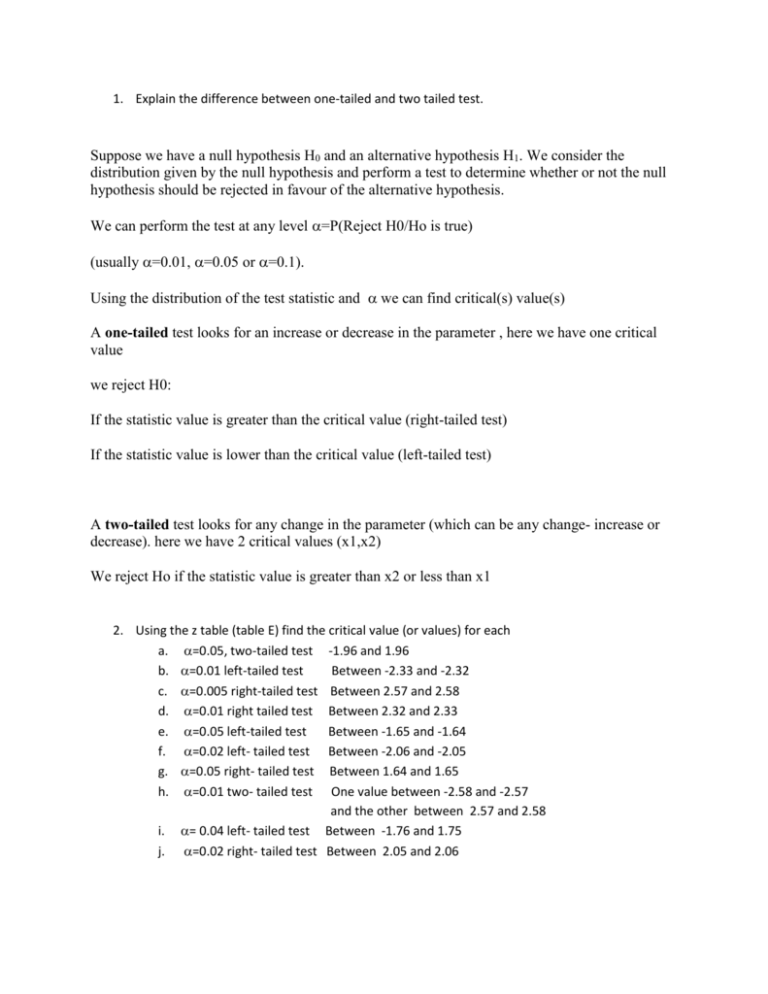
1. Explain the difference between one-tailed and two tailed test.
Suppose we have a null hypothesis H0 and an alternative hypothesis H1. We consider the
distribution given by the null hypothesis and perform a test to determine whether or not the null
hypothesis should be rejected in favour of the alternative hypothesis.
We can perform the test at any level =P(Reject H0/Ho is true)
(usually =0.01, =0.05 or =0.1).
Using the distribution of the test statistic and we can find critical(s) value(s)
A one-tailed test looks for an increase or decrease in the parameter , here we have one critical
value
we reject H0:
If the statistic value is greater than the critical value (right-tailed test)
If the statistic value is lower than the critical value (left-tailed test)
A two-tailed test looks for any change in the parameter (which can be any change- increase or
decrease). here we have 2 critical values (x1,x2)
We reject Ho if the statistic value is greater than x2 or less than x1
2. Using the z table (table E) find the critical value (or values) for each
a. =0.05, two-tailed test -1.96 and 1.96
b. =0.01 left-tailed test
Between -2.33 and -2.32
c. =0.005 right-tailed test Between 2.57 and 2.58
d. =0.01 right tailed test Between 2.32 and 2.33
e. =0.05 left-tailed test
Between -1.65 and -1.64
f. =0.02 left- tailed test Between -2.06 and -2.05
g. =0.05 right- tailed test Between 1.64 and 1.65
h. =0.01 two- tailed test One value between -2.58 and -2.57
and the other between 2.57 and 2.58
i. = 0.04 left- tailed test Between -1.76 and 1.75
j. =0.02 right- tailed test Between 2.05 and 2.06
3. Credit card dept: it has been reported that the average credit card debt for college seniors is
$3262. The student senate at a large university feels that their seniors have a debt much less
than this, so it conducts a study of 50 randomly selected seniors and finds that the average debt
is $2995, and the population standard deviation is $1100. With = 0.05, is the student senate
correct?
H0: = 3262
Ha: < 3262
n=50
x-bar=2995
=1100
= 0.05
z-statistic =(2995-3292)/(1100/50) = -1.909
Critical value = -z(0.025)=-1.96
Reject region: {z/z<-1.96}
Since the statistic value is greater than -1.96 we don´t reject H0
Answer: : Student senate is not correct
4. What is meant by a P-value?
P-value =P(having a statistic value greater than
The p-value is the probability of obtaining a test statistic at least as extreme as the one that was
actually observed, assuming that the null hypothesis is true.
The lower the p-value, the less likely the result is if the null hypothesis is true, and consequently
the more "significant" the result is, in the sense of statistical significance. One often Rejects H0
hypothesis, if the p-value is less than 0.05 or 0.01
5. Soft drink consumption: A researcher claims that the yearly consumption of soft drinks per
person is 52 gallons. In a sample of 50 randomly selected people, the mean of the yearly
consumption was 56.3 gallons. The standard deviation of the population is 3.5 gallons. Find
the P-value, is the researcher’s claim valid?
H0: =52
Ha: ≠52 (two tailed)
n=50, x-bar=56.3, =3.5,
z-statistic = (56.3-52)/(3.5/50)=8.687
p-value = 2P(z>8.687)=0 (p-value is almost 0)
Answer: Since the p-value is almost 0 we have a strong evidence to reject the claim, we can´t say that
the yearly consumption of soft drinks per person is 52 gallons.
6. Using table F find the P-value interval for each test value
a. T=2.321 n=15, right tailed : (0.01, 0.025)
b. T=1.945, n= 28, two tailed : (0.05, 0.1)
c. T= -1.267, n=8, two tailed : (0.2, 0.5)
d. T=1.562, n=17, tow tailed: (0.1, 0.2)
e. T=3.025, n=24, right tailed: (0, 0.005)
f. T= -1.145, n=5, left tailed: (0.1, 0.25)
g. T=2.1679, n=13, two tailed: ( 0.02, 0.05)
h. T=0665, n=10. Right tailed: (0.25,0.5)
7. Commute time to work: A survey of 15 large U.S. cities finds that the average commute time
one way is 25.4 min. A chamber of commerce executive feels that the commute in his city is less
and wants to publicize this. He randomly selects 25 commuters and finds the average is 22.1 min
with a standard deviation of 5.3 min. at =0.10, is he correct?
Ho: ≥25.4
Ha: <25.4
n=25, x-bar=22.1, s=5.3, =0.10
t-statistic = (22.1-25.4)/(5.3/25)=-3.113
Critical value = -t(0.1,24) = -1.318 (Using table F)
Reject region: {t/t<-1.318}
Decision: since the statistic (-3.113)<-1.318 we reject H0
Answer: Yes, he is correct
8. Water consumption: the old farmer’s almanac stated that the average consumption of water
per person per day was 123 gallons. To test the hypothesis that this figure may no longer be
true, a researcher randomly selected 16 people and found that they used on average 119
gallons per day and s=5.3. at =0.05. is there enough evidence to say that the old farmer’s
almanac figure might no longer be correct? Use the P-Value method.
H0: =123
Ha: ≠123
n=16,x-bar=119,s=5.3,=0.05
t-statistic = (119-123)/(5.3/16)=-3.019 (df=15)
p-value = 2P(t<-3.019)=0.0043
9. What are the mean and the standard deviation of a proportion?
The mean is p and standard deviation is [p(1-p)/n]
10. Natural gas heat: The energy information administration reported that 51.7% of homes in
the United States were heated by natural gas. A random sample of 200 homes found that
115 were heated by natural gas. Does the evidence support the claim? Or has the percentage
changed? = 0.05 and the P-value method. What could be different is the sample were
taken in a different geographic area?
Ho: p=0.517
Ha: p≠0.517
n=200, x=115, p^=115/200=0.575
z-satistic = (0.575-0.517)/((0.517)(0.483)/200)=1.64
p-value = 2P(Z>1.64)=0.101
Decision: since the p-value(0.101) is greater than 0.05 we don´t reject H0
Answer:The evidence supports the claim (we don´t have enough evidence to say that the
percentage has changed)
11. Using table G, find the P-value interval for each X^2 test value
a. X^2 = 29.321, n=16 , right tailed (0.01,0.025)
b. X^2 =10.215 , n=25 , left tailed (0, 0.005)
c. X^2 =24.672 , n= 11 ,two tailed (0.02, 0.05)
d. X^2 =23.722 , n= 9, right tailed (0, 0.005)
e. X^2 =13.974 , n= 28, two tailed (0.02, 0.05)
f. X^2 =10.571 , n= 19, left tailed (0.01, 0.05)
g. X^2 = 12.144, n= 6, two tailed (0.1, 0.2)
h. X^2 = 8.201, n= 23, two tailed (0, 0.01)
12. Interstate speeds: It has been reported that the standard deviation of the speeds of drivers on
Interstate 75 near Findlay, Ohio, is 8 miles per hour for all vehicles. A driver feels from
experience that this is very low. A survey is conducted, and for 50 drivers the standard deviation
is 10.5 miler per hour. At =0.05, is the driver correct?
H0: =8
Ha: >8
n=50, s=10.5,=0.05
Chi-square statistic: 49(10.5)2/82 = 84.41
Critical value is chi-inv(0.05,49)=66.34
Since the statistic =84.41>66.34 we reject H0
Decision: the driver is correct, we have enough evidence to say that the deviation ( 8 miles
per hour ) is very low

