pola27109-sup-0001
advertisement
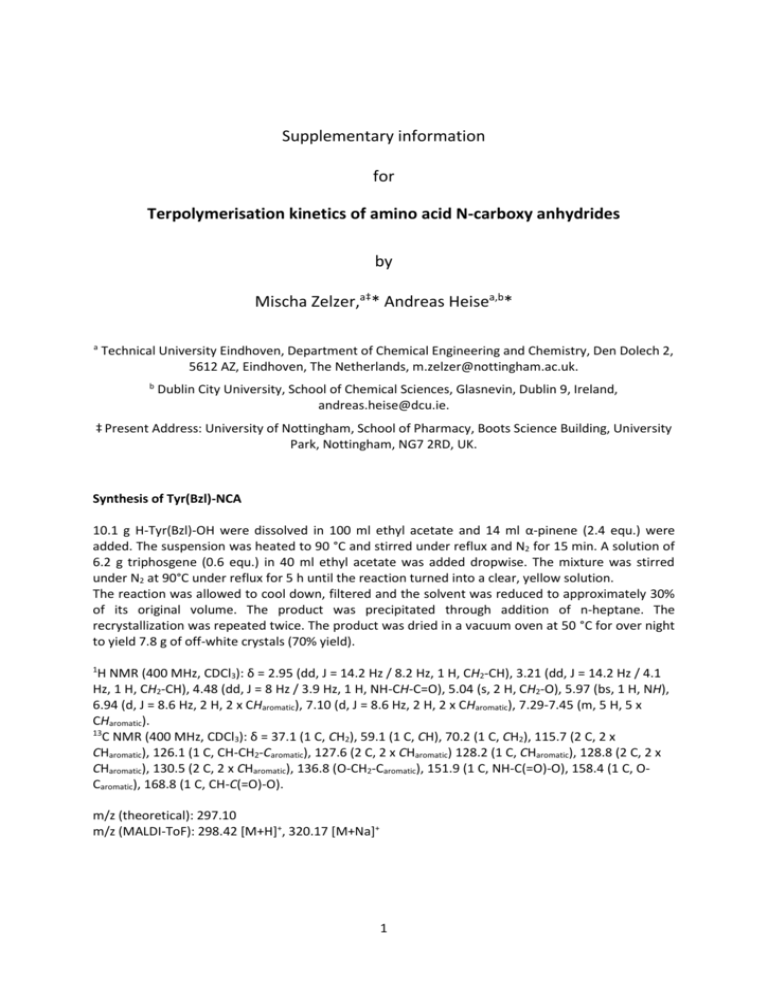
Supplementary information for Terpolymerisation kinetics of amino acid N-carboxy anhydrides by Mischa Zelzer,a‡* Andreas Heisea,b* a Technical University Eindhoven, Department of Chemical Engineering and Chemistry, Den Dolech 2, 5612 AZ, Eindhoven, The Netherlands, m.zelzer@nottingham.ac.uk. b Dublin City University, School of Chemical Sciences, Glasnevin, Dublin 9, Ireland, andreas.heise@dcu.ie. ‡ Present Address: University of Nottingham, School of Pharmacy, Boots Science Building, University Park, Nottingham, NG7 2RD, UK. Synthesis of Tyr(Bzl)-NCA 10.1 g H-Tyr(Bzl)-OH were dissolved in 100 ml ethyl acetate and 14 ml α-pinene (2.4 equ.) were added. The suspension was heated to 90 °C and stirred under reflux and N2 for 15 min. A solution of 6.2 g triphosgene (0.6 equ.) in 40 ml ethyl acetate was added dropwise. The mixture was stirred under N2 at 90°C under reflux for 5 h until the reaction turned into a clear, yellow solution. The reaction was allowed to cool down, filtered and the solvent was reduced to approximately 30% of its original volume. The product was precipitated through addition of n-heptane. The recrystallization was repeated twice. The product was dried in a vacuum oven at 50 °C for over night to yield 7.8 g of off-white crystals (70% yield). 1 H NMR (400 MHz, CDCl3): δ = 2.95 (dd, J = 14.2 Hz / 8.2 Hz, 1 H, CH2-CH), 3.21 (dd, J = 14.2 Hz / 4.1 Hz, 1 H, CH2-CH), 4.48 (dd, J = 8 Hz / 3.9 Hz, 1 H, NH-CH-C=O), 5.04 (s, 2 H, CH2-O), 5.97 (bs, 1 H, NH), 6.94 (d, J = 8.6 Hz, 2 H, 2 x CHaromatic), 7.10 (d, J = 8.6 Hz, 2 H, 2 x CHaromatic), 7.29-7.45 (m, 5 H, 5 x CHaromatic). 13 C NMR (400 MHz, CDCl3): δ = 37.1 (1 C, CH2), 59.1 (1 C, CH), 70.2 (1 C, CH2), 115.7 (2 C, 2 x CHaromatic), 126.1 (1 C, CH-CH2-Caromatic), 127.6 (2 C, 2 x CHaromatic) 128.2 (1 C, CHaromatic), 128.8 (2 C, 2 x CHaromatic), 130.5 (2 C, 2 x CHaromatic), 136.8 (O-CH2-Caromatic), 151.9 (1 C, NH-C(=O)-O), 158.4 (1 C, OCaromatic), 168.8 (1 C, CH-C(=O)-O). m/z (theoretical): 297.10 m/z (MALDI-ToF): 298.42 [M+H]+, 320.17 [M+Na]+ 1 Figure S1. Chromatogram of Tyr(Bzl) at 10 mg ml-1 (top) and the quenched Tyr(Bzl)-NCA at 100 mg ml-1 (middle) obtained from HPLC measurements. Mass spectra of the quenched Tyr(Bzl)-NCA (bottom) obtained from LC-MS analysis. Figure S2. Calibration curves for Tyr(Bzl)-NCA. The average values are shown and have been used to obtain the linear calibration line (n = 3, error bars represent standard deviations). 2 Figure S3. HPLC chromatograms for time-points at 60 min intervals during the co-polymerisation of Glu(Bzl)-NCA / Tyr(Bzl)-NCA = 3:1 (top) and Lys(Z)-NCA / Tyr(Bzl)-NCA = 3:1 (bottom). 3 Figure S4. Comparison of the course of the polymerisation of binary mixtures of Glu(Bzl) / Tyr(Bzl and Lys(Z) / Tyr(Bzl) at two different monomer ratios using either IR spectroscopy or HPLC. Figure S5. Determination of the reaction rate constants (k) for the copolymerisation of Glu(Bzl)-NCA / Lys(Z)-NCA (kinetic data reported in Ref 15 was used), Glu(Bzl)-NCA / Tyr(Bzl)-NCA and Lys(Z)-NCA / [𝑁𝐶𝐴] Tyr(Bzl)-NCA using the integrated rate law for a first order reaction: 𝑙𝑛 ([𝑁𝐶𝐴] ) = −𝑘𝑡 ([NCA] – 0 concentration of the respective amino acid NCA, [NCA]0 – theoretical NCA starting concentration; t – reaction time). k was determined from the slope of the linear regression lines. Datapoints originate from single kinetic experiments. 4 Figure S6. 1H-NMR spectrum of the E/Y copolypeptide in TFA obtained after reaction of Glu(Bzl)-NCA and Tyr(Bzl)-NCA for 20 min at a ratio of 1:1. Figure S7. 1H-NMR spectrum of the K/Y copolypeptide in TFA obtained after reaction of Lys(Z)-NCA and Tyr(Bzl)-NCA for 20 min at a ratio of 1:1. 5 Table S1. Data used for the calculation of the copolymerisation parameters for the Glu(Bzl) / Tyr(Bzl) system. feed feed polymer composition calculated values compo- ratio (f) peak area peak area ratio f2/F f(1-F)/F ξ a b c sition Glu(Bzl) Tyr(Bzl) (F) 1:1 1.00 121292407 119947459 2.02 0.49 0.51 0.31 11:9 1.22 106416870 75630933 2.81 0.53 0.79 0.32 3:2 1.50 260800898 172810428 3.02 0.75 1.00 0.40 13:7 1.86 178440191 92551873 3.86 0.89 1.38 0.44 7:3 2.33 196718090 88089033 4.47 1.22 1.81 0.52 3:1 3.00 183332738 55401857 6.62 1.82 2.39 0.62 4:1 4.00 151365192 47646267 6.35 2.52 3.37 0.69 a obtained from 1H-NMR spectra by fitting peaks to the glutamic acid backbone CH region b obtained from 1H-NMR spectra by fitting peaks to tyrosine’s CH2 region c calculated after division of the Tyr(Bzl) peak areas by two η 0.31 0.48 0.54 0.68 0.78 0.81 0.93 Table S2. Data used for the calculation of the copolymerisation parameters for the Lys(Z) / Tyr(Bzl) system. feed feed polymer composition calculated values compo- ratio (f) peak area peak area ratio f2/F f(1-F)/F ξ η a b c sition Lys(Z) Tyr(Bzl) (F) 1:1 1.00 52384067 81779244 0.65 1.56 -0.56 0.41 -0.15 11:9 1.22 22718009 22711780 1.00 1.49 0.00 0.39 0.00 3:2 1.50 21775580 19278802.5 1.13 1.99 0.17 0.47 0.04 13:7 1.86 32757442 20788679 1.58 2.19 0.68 0.49 0.15 7:3 2.33 29837926 16996000.5 1.76 3.10 1.00 0.58 0.19 3:1 3.00 64564100 25063594 2.58 3.49 1.83 0.60 0.32 4:1 4.00 61248795 17397989 3.52 4.54 2.86 0.67 0.42 1:1 1.00 20660327 54053565 0.76 1.31 -0.31 0.36 -0.09 11:9 1.22 29603282 49574736 1.19 1.25 0.20 0.35 0.06 3:2 1.50 21773347 32678375 1.33 1.69 0.37 0.42 0.09 13:7 1.86 22636043 29926022 1.51 2.28 0.63 0.50 0.14 7:3 2.33 86971562 98529637 1.77 3.08 1.01 0.57 0.19 3:1 3.00 51639933 45912325 2.25 4.00 1.67 0.64 0.26 4:1 4.00 27821233 14901292 3.73 4.28 2.93 0.65 0.45 a 1 obtained from H-NMR spectra by fitting peaks to the lysine backbone CH region b obtained from 1H-NMR spectra by fitting peaks to tyrosine’s CH2 region c calculated after division of the Tyr(Bzl) peak areas by two 6 Figure S8. Determination of the copolymerisation parameters for the Glu(Bzl) / Tyr(Bzl) copolymerisation using the approach by Fineman-Ross (a) and Kelen-Tüdös (b). 7 Figure S9. Determination of the copolymerisation parameters for the Lys(Z) / Tyr(Bzl) copolymerisation using the approach by Fineman-Ross (a) and Kelen-Tüdös (b). 8 Figure S10. GPC data for the terpolymers obtained from Glu(Bzl)-NCA, Lys(Z)-NCA and Tyr(Bzl)-NCA at various ratios. 9 Figure S11. Concentrations of monomers obtained from HPLC measurements during the course of the terpolymerisation using seven different ratios of Glu(Bzl)-NCA, Lys(Z)-NCA Tyr(Bzl)-NCA and total conversion of monomers over time. 10 Figure S12. Determination of the reaction rate constants (k) for the terpolymerisation of Glu(Bzl)NCA / Lys(Z)-NCA / Tyr(Bzl)-NCA at various monomer starting concentration using the integrated rate [𝑁𝐶𝐴] law for a 1st order reaction: 𝑙𝑛 ([𝑁𝐶𝐴] ) = −𝑘𝑡 ([NCA] – concentration of the respective amino acid 0 NCA, [NCA]0 – theoretical NCA starting concentration; t – reaction time). k was determined from the slope of the linear regression lines. Datapoints originate from single kinetic experiments. 11 Figure S13. 1H-NMR spectrum of the terpolymer in TFA obtained after reaction for 20 min at a monomer ratio of 1:1:1 in the feed. 12
