Postdoctoral Position in Theoretical Biophysical Chemistry
advertisement
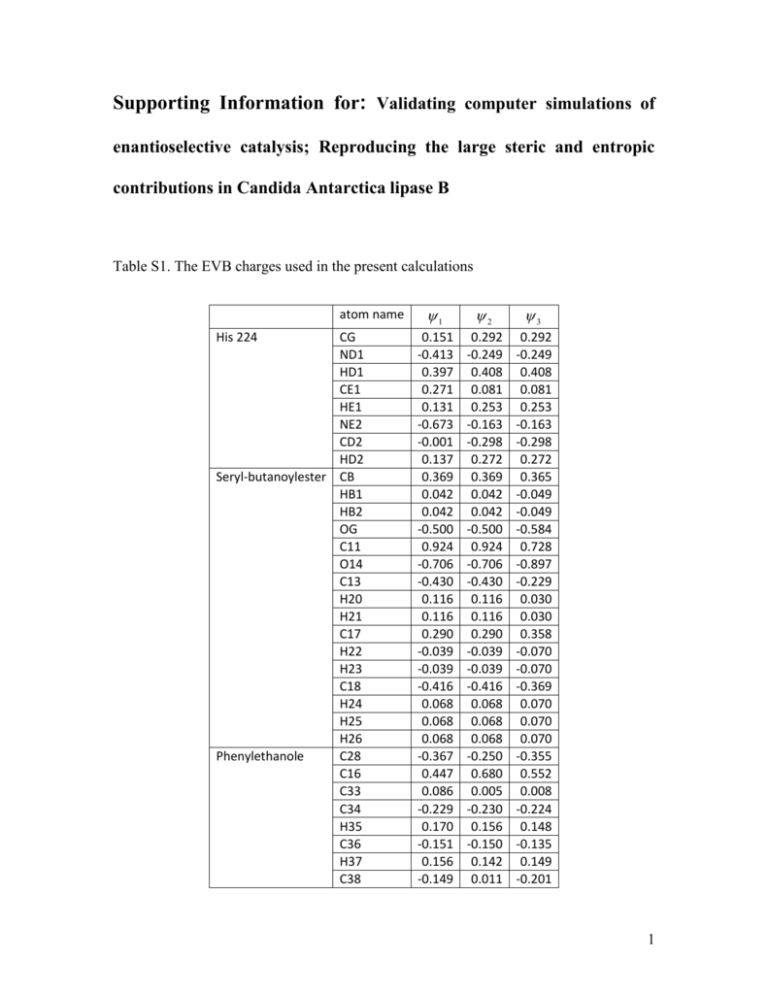
Supporting Information for: Validating computer simulations of enantioselective catalysis; Reproducing the large steric and entropic contributions in Candida Antarctica lipase B Table S1. The EVB charges used in the present calculations atom name His 224 CG ND1 HD1 CE1 HE1 NE2 CD2 HD2 Seryl-butanoylester CB HB1 HB2 OG C11 O14 C13 H20 H21 C17 H22 H23 C18 H24 H25 H26 Phenylethanole C28 C16 C33 C34 H35 C36 H37 C38 1 2 3 0.151 -0.413 0.397 0.271 0.131 -0.673 -0.001 0.137 0.369 0.042 0.042 -0.500 0.924 -0.706 -0.430 0.116 0.116 0.290 -0.039 -0.039 -0.416 0.068 0.068 0.068 -0.367 0.447 0.086 -0.229 0.170 -0.151 0.156 -0.149 0.292 -0.249 0.408 0.081 0.253 -0.163 -0.298 0.272 0.369 0.042 0.042 -0.500 0.924 -0.706 -0.430 0.116 0.116 0.290 -0.039 -0.039 -0.416 0.068 0.068 0.068 -0.250 0.680 0.005 -0.230 0.156 -0.150 0.142 0.011 0.292 -0.249 0.408 0.081 0.253 -0.163 -0.298 0.272 0.365 -0.049 -0.049 -0.584 0.728 -0.897 -0.229 0.030 0.030 0.358 -0.070 -0.070 -0.369 0.070 0.070 0.070 -0.355 0.552 0.008 -0.224 0.148 -0.135 0.149 -0.201 1 H39 C40 H41 C42 H43 O15 H29 H30 H31 H27 H10 0.171 -0.151 0.156 -0.229 0.170 0.827 0.083 0.083 0.083 -0.005 0.503 0.149 -0.150 0.141 -0.230 0.156 -1.318 0.023 0.023 0.023 -0.181 0.404 0.156 -0.135 0.149 -0.224 0.148 -0.632 0.072 0.072 0.072 -0.024 0.404 Table S2. Morse bond parameters: M (b) DM (1 e (b b0 ) ) 2 Bond type DM b0 C0-H0 C0-O0 O0-C+ C+-C0 C+-N+ C+-C+ N+-H+ C+-H+ O0-H0 C0-OC0-C0 100.4 93.0 93.0 96.0 94.0 96.0 98.3 100.4 102.0 93.0 96.0 1.10 1.50 1.25 1.40 1.40 1.40 1.10 1.10 0.96 1.40 1.54 2.0 0.8 2.0 2.0 2.0 2.0 2.0 2.0 2.0 2.0 0.8 Table S3. Angle parameters: V ( ) 1 k ( 0 ) 2 2 Angle type 1 k 2 0 H0-C0-H0 H0-C0-O0 C+-C0-C0 C+-C0-H0 H0-C0-C0 C0-C0-C0 O0-C0-C+ O0-C+-O0 O0-C+-C0 50.0 50.0 50.0 50.0 50.0 50.0 50.0 50.0 50.0 109.5 109.5 109.5 109.5 109.5 109.5 109.5 120.0 120.0 2 N+-C+-C+ O0-C+-O0 C+-N+-H+ N+-C+-H+ N+-C+-N+ C+-C+-H+ C0-C+-C+ C+-C+-C+ C+-N+-C+ C0-O0-H0 50.0 50.0 50.0 50.0 50.0 50.0 50.0 50.0 90.0 80.0 120.0 120.0 120.0 120.0 120.0 120.0 120.0 120.0 120.0 120.0 Table S4. Torsion angle parameters: V k (1 cos(n 0 )) Angle type k n 0 *-C0-O0-* *-C0-C+-* *-O0-C+-* *-C+-N+-* *-C+-C+-* *-C0-C0-* 2.0 2.0 15.0 15.0 15.0 1.0 3.0 3.0 2.0 2.0 2.0 3.0 0.0 0.0 180.0 180.0 180.0 0.0 Table S5. Improper torsion angle parameters: V k (1 cos(n 0 )) Angle type k n 0 *-O0-O0-* *-N+-H+-* *-C+-N+-* *-C0-C+-* *-C+-H+-* *-C+-C+-* 15.0 15.0 15.0 15.0 15.0 15.0 2.0 2.0 2.0 2.0 2.0 2.0 180.0 180.0 180.0 180.0 180.0 180.0 Table S6. Nonbonded parameters (repulsion function): Vnb Ce r Atom type O--C0 O0-C0 O0-O0 O0-OO--H0 O0-H0 C 19999.0 19999.0 30000.0 30000.0 4000.0 4000.0 3.8 3.8 3.0 3.0 4.0 4.0 3 * Table S7. Nonbonded parameters (van der Waals): Vnb * r r Atom type H0 C0 C+ N+ O0 O- r 12 r* * 7.0 632.0 632.0 774.0 774.0 1400.0 0.0 24.0 24.0 24.0 24.0 24.0 * 2 r 6 Table S8. EVB mapping parameters used in the present calculations. EVB mapping parameters 1 2 2 3 Hij Aij e ( r r0 ) 10.3 35.0 i j 80.0 45.0 Table S9. Calculated free energies (in kcal/mol) for perturbing the restraints from K=10.0 to 0.03 for both chemical reactions and both the RS and the TS of each enantiomer complexed to the WT. The individual free energy contribution for the PT and NA are given for each enantiomer using GPT,Relax and GNA,Relax and their sum providing the total barrier gcat,calc,relax. Additionally the barriers obtained without the free energy of removing the restraints are given in column labeled gcat,calc. run1 run2 run3 run4 AVG STDEV MUE run1 run2 run run4 AVG STDEV MUE GPT,Relax WT-R (RS1) -6.0 -6.2 -6.1 -5.5 -6.0 0.3 0.2 GPT,Relax WT-S (RS1) -5.9 -5.4 -5.7 -5.8 -5.7 0.2 0.1 GPT,Relax WT-R (TS1) -6.9 -6.6 -6.3 -6.9 -6.7 0.3 0.1 GPT,Relax WT-S (TS1) -6.5 -6.3 -6.7 -6.9 -6.6 0.3 0.1 GNA,Relax WT-R (RS2) -5.4 -5.7 -5.3 -5.9 -5.6 0.3 0.1 GNA,Relax WT-S (RS2) -5.5 -5.8 -5.3 -5.9 -5.6 0.3 0.1 GNA,Relax WT-R (TS2) -6.9 -7.1 -6.6 -6.3 -6.7 0.4 0.2 GNA,Relax WT-S (TS2) -6.9 -7.2 -7.3 -7.0 -7.1 0.2 0.1 GPT,Relax WT-R GNA,Relax WT-R gcat,calc,relax WT-R gcat,calc WT-R 9.2 10.7 9.9 9.1 9.7 0.4 0.2 GPT,Relax WT-S 4.4 4.9 5.6 5.1 5 0.7 0.3 13.6 15.6 15.5 14.2 14.7 1.0 0.5 gNA,Relax WT-S gcat,calc,relax WT-S 16.0 17.4 17.0 16.0 16.6 1.1 0.5 gcat,calc WT-S 11.2 13.3 10.0 10.7 11.3 1.4 0.7 11.9 9.3 9.2 10.6 10.3 1.0 0.5 23.1 22.6 19.2 21.3 21.6 2.5 1.2 25.1 24.9 22.2 23.5 23.9 2.5 1.3 4 Figures Figure S1. The three resonance structures ( i ) used to describe the deacylation reaction of CalB. 1 , 2 and 3 describe the reactant state, the product of the proton transfer step and the tetrahedral intermediate, respectively. Figure S2. Thermodynamic cycle for calculating the “relaxed” free energies of the RS and TS of the PT and the NA. The top horizontal arrows reflect the free energy provided by the EVB at K=10.0, while the vertical arrows indicate the perturbation of the restraints towards 0.03. Finally, the bottom horizontal arrow provides us with the relaxed total barrier g cat ,calc ,relax . 5 Figure S3. Diagram of the calculated activation barriers (in kcal/mol ) for the PT (RS1 and TS1 in the figure) and NA (RS2 and TS2 in the figure) for the WT and in solution using the EVB method. Here the barriers are given with and without the specialized restraint relaxation treatment (not for the solution). 6 7
