Earthquake Data Analysis Worksheet: Real-Time USGS Data
advertisement
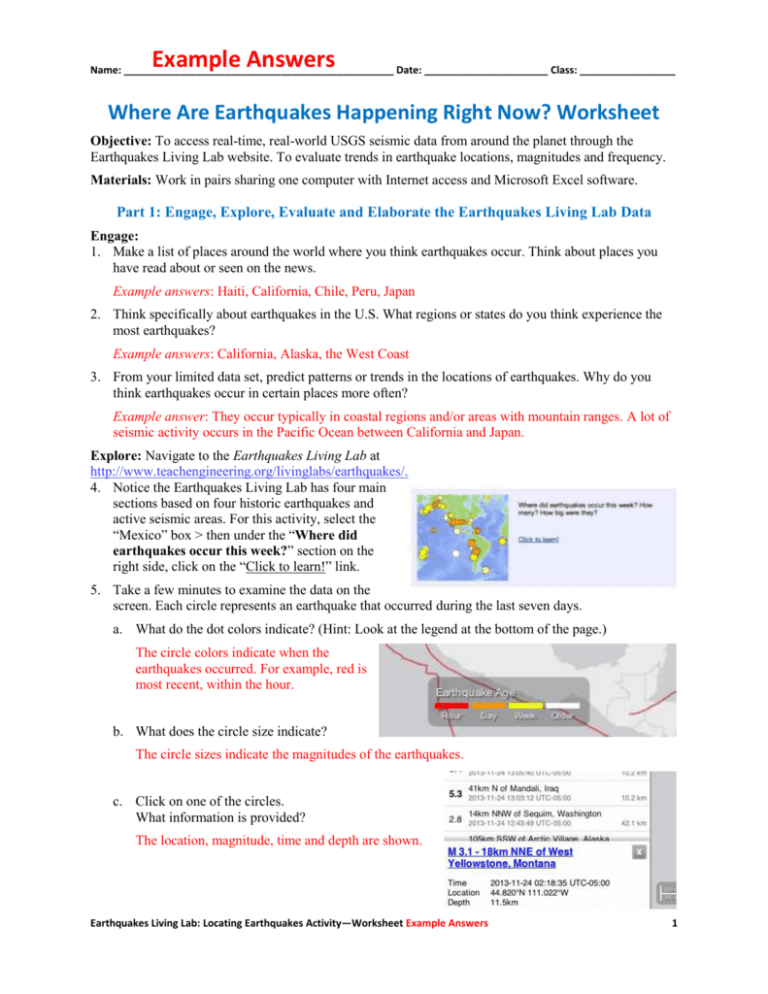
Example Answers Name: ________________________________________________ Date: ______________________ Class: _________________ Where Are Earthquakes Happening Right Now? Worksheet Objective: To access real-time, real-world USGS seismic data from around the planet through the Earthquakes Living Lab website. To evaluate trends in earthquake locations, magnitudes and frequency. Materials: Work in pairs sharing one computer with Internet access and Microsoft Excel software. Part 1: Engage, Explore, Evaluate and Elaborate the Earthquakes Living Lab Data Engage: 1. Make a list of places around the world where you think earthquakes occur. Think about places you have read about or seen on the news. Example answers: Haiti, California, Chile, Peru, Japan 2. Think specifically about earthquakes in the U.S. What regions or states do you think experience the most earthquakes? Example answers: California, Alaska, the West Coast 3. From your limited data set, predict patterns or trends in the locations of earthquakes. Why do you think earthquakes occur in certain places more often? Example answer: They occur typically in coastal regions and/or areas with mountain ranges. A lot of seismic activity occurs in the Pacific Ocean between California and Japan. Explore: Navigate to the Earthquakes Living Lab at http://www.teachengineering.org/livinglabs/earthquakes/. 4. Notice the Earthquakes Living Lab has four main sections based on four historic earthquakes and active seismic areas. For this activity, select the “Mexico” box > then under the “Where did earthquakes occur this week?” section on the right side, click on the “Click to learn!” link. 5. Take a few minutes to examine the data on the screen. Each circle represents an earthquake that occurred during the last seven days. a. What do the dot colors indicate? (Hint: Look at the legend at the bottom of the page.) The circle colors indicate when the earthquakes occurred. For example, red is most recent, within the hour. b. What does the circle size indicate? The circle sizes indicate the magnitudes of the earthquakes. c. Click on one of the circles. What information is provided? The location, magnitude, time and depth are shown. Earthquakes Living Lab: Locating Earthquakes Activity—Worksheet Example Answers 1 Name: ________________________________________________ Date: ______________________ Class: _________________ d. Using the legend, complete a quick visual survey of the map to answer the following questions: (Hint: You may need to zoom out.) Approximately how many earthquakes occurred within the last hour? Example answer: No earthquakes (red circles) occurred during the last hour. Approximately how many earthquakes occurred within the last day? Example answer: About 29 earthquakes happened during the past day (orange circles). Where did the greatest magnitude earthquakes occur this week? Example answer: The highest magnitude earthquake was 5.7 and occurred in Iran. (Tip: Look at the screen’s left-side listing OR sort the earthquakes by magnitude under Settings.) Explain: 6. Looking at the website, examine the general location and frequency of earthquakes. a. Describe any patterns or trends you observe in the location of earthquakes. Example answer: It appears that earthquakes typically occur in areas with mountain ranges or where there is movement in the Earth’s crust. The Ring of Fire around the Pacific basin has the highest numbers of powerful earthquakes and volcanic eruptions. b. How do these actual trends compare to your original predictions in the Engage section above? Example answer: Earthquakes do occur along coastlines and newer mountain ranges. Fewer earthquakes happen in the middles of countries and areas where the terrain is very flat, such as Florida or Kentucky. c. Why do you think most earthquakes occur in these locations and not other places on Earth? Example answer: These areas are without tectonic plate fault planes and any Earth’s crust movement. Evaluate: 7. Click on the Settings icon (the gear-shaped button) in the upper right: Then turn on the “U.S. faults” overlay. a. Looking at the newly added red U.S. fault lines, what do you think a fault is? How do you think they are associated with earthquakes? Example answer: A fault is a crack in the Earth’s crust, resulting from the displacement of one side with respect to the other. Large faults form from the result of plate tectonic forces. Only active faults cause earthquakes and many faults are inactive. b. Why do you think earthquakes are located along some faults? Do they occur on every fault line? Example answer: Some fault lines do not have much seismic activity nor movement. While most earthquakes occur along fault lines, not all fault lines have earthquakes. Earthquakes Living Lab: Locating Earthquakes Activity—Worksheet Example Answers 2 Name: ________________________________________________ Date: ______________________ Class: _________________ Part 2: Analyze the Earthquakes Living Lab Data 8. When you click on a circle on the map, the left part of the screen displays information for that specific earthquake. Make a quick list of available information for your reference (copy a few lines of the chart, or cut and paste an image of it). California example 9. Click on other earthquakes in the list on the left side of the page. What additional information is available to you? Doing this provides additional information about these earthquakes around the world. When you click on an earthquake listed on the left side of the screen, it highlights its location on the map by turning its circle a teal color. 10. Perform a cursory (quick) overview of the first 25 most-recent earthquakes on the list. Estimate the maximum, minimum and average magnitude from this data set. (Hint: As necessary, scroll down through the list to see more than the data currently on your screen.) Example: We estimate the maximum was 5.4, the minimum was 2.8, and the average was around 4.0. 11. Using Excel, perform a detailed analysis of the first 25 most-recent earthquakes on the list. a. Enter (copy) the magnitude values. b. Calculate mean, median, and mode. c. Identify the maximum and minimum magnitudes. Elaborate: 12. Imagine if you had an entire year’s worth of data to analyze. a. Do you think the mean, median, or mode would change? Although the mean, median and mode could change significantly, it is difficult to predict. If several large earthquakes happened in the last week, the mean and median would probably decrease with a year’s worth of data. Similarly, they would probably increase if no large earthquakes occurred in the last week. The maximum and minimum, however, will almost certainly change, given data for an entire year. If yes, why do you think it would change and by how much? Estimate it. The average magnitude would remain about the same, but the mode would change to reflect the area with the most movement in the Earth’s crust. If no, explain why it would not change. b. Do you think the maximum and minimum magnitude values would change? If yes, why do you think it would change and by how much (estimate it)? Example answer: We think they would change by ~2-3 points of magnitude (1 for the minimum and ~8 for the maximum for the Richter scale of 1-10), since it is unlikely that we experience both the most and least severe earthquakes of the Earth in this week. The absolutely max/min would change, but the averages would remain about the same. If no, explain why it would not change. Congratulations—you have completed this activity! This is only a small part of all there is to know about earthquakes, and researchers are learning new things all the time. Feel free to come back to this resource to keep learning as often as you like. Earthquakes Living Lab: Locating Earthquakes Activity—Worksheet Example Answers 3

