Project 2: Estimating Probabilities of Card Events
advertisement
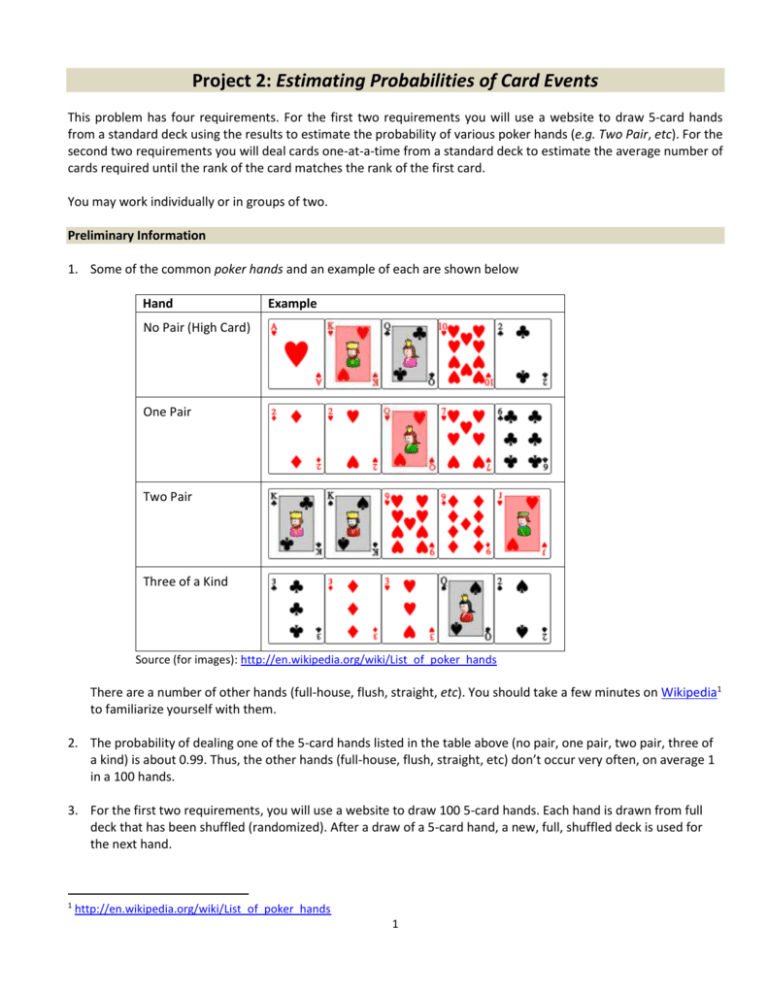
Project 2: Estimating Probabilities of Card Events This problem has four requirements. For the first two requirements you will use a website to draw 5-card hands from a standard deck using the results to estimate the probability of various poker hands (e.g. Two Pair, etc). For the second two requirements you will deal cards one-at-a-time from a standard deck to estimate the average number of cards required until the rank of the card matches the rank of the first card. You may work individually or in groups of two. Preliminary Information 1. Some of the common poker hands and an example of each are shown below Hand Example No Pair (High Card) One Pair Two Pair Three of a Kind Source (for images): http://en.wikipedia.org/wiki/List_of_poker_hands There are a number of other hands (full-house, flush, straight, etc). You should take a few minutes on Wikipedia1 to familiarize yourself with them. 2. The probability of dealing one of the 5-card hands listed in the table above (no pair, one pair, two pair, three of a kind) is about 0.99. Thus, the other hands (full-house, flush, straight, etc) don’t occur very often, on average 1 in a 100 hands. 3. For the first two requirements, you will use a website to draw 100 5-card hands. Each hand is drawn from full deck that has been shuffled (randomized). After a draw of a 5-card hand, a new, full, shuffled deck is used for the next hand. 1 http://en.wikipedia.org/wiki/List_of_poker_hands 1 4. For requirements 3 and 4, you will deal cards one-at-a-time from a standard deck. You will deal a card and observe its rank2. Then, you will continue to deal cards until you observe another card with the same rank. For requirement 3 you will count the number of cards it takes to match the initial rank. Example 1 1st Card King-Hearts 2nd Card King-Spades Thus, the count would be 1. Example 2 1st 4-H 2nd 8-C 3rd J-S 4th K-D 5th 3-D 6th 9-H 7th 8-D 8th 4-S Thus, the count would be 7. 5. You should review: discrete probability distribution estimating probabilities empirically expected value and standard deviation Project Requirements 1. (60 points) Empirically determine the probability distribution of the standard poker hands. Note, there is a high chance that you will only encounter the 4 hands shown above (No Pair, 1 pair, 2 pairs, 3-of-a-kind). However, you should record any other hand that might occur. Do: Deal3 at least 100 5-card hands. Tally the outcomes. a. A nicely formatted table showing the four outcomes, the corresponding frequencies, and estimated probabilities. b. A bar graph showing the outcomes and the probabilities. 2. (15 points) Use the internet to find the true probabilities for the probability distribution from 1. Turn in: Add a column to the table from requirement 1 to record the true probabilities. Cite your source. 3. (10 points) Empirically estimate the expected value for the number of cards required to match the rank of the first card as well as the standard deviation. Do: Deal4 a card and write down it’s rank (note: you are using a different site to deal the cards as this site will be quicker than using the previous on). Then continue to deal cards until that rank is observed again. Write down the number of cards required (this is your data value). When you are done, choose “New Deck”. Repeat this at 2 http://en.wikipedia.org/wiki/Glossary_of_card_game_terms#R http://www.random.org/playing-cards/ 4 http://www.brainingcamp.com/blog/8-17-2011/index.html 2 3 least 50 times. When you are done, you will have at least 50 data values. To estimate the expected value and standard deviation, calculate the average and standard deviation of the values. Turn in: The data values, the average and standard deviation. 3 4. (15 points) Consider the problem described in requirement 3. Empirically determine the probability distribution for the number of cards required to obtain a match. Technically, this random variable ranges from 1 to 48; however many of these are not very likely. Turn in: a. A nicely formatted table showing the four outcomes, the corresponding frequencies, and estimated probabilities. In other words, don’t show values that didn’t occur. b. A bar graph showing the outcomes and the probabilities. Submission Requirements One person from each group will submit a neatly formatted Word or pdf document to Blazeview in this format: Project 3 Name(s): 1. 2. 3. 4. 4
