jbi12533-sup-0001-AppendixS1-S2
advertisement
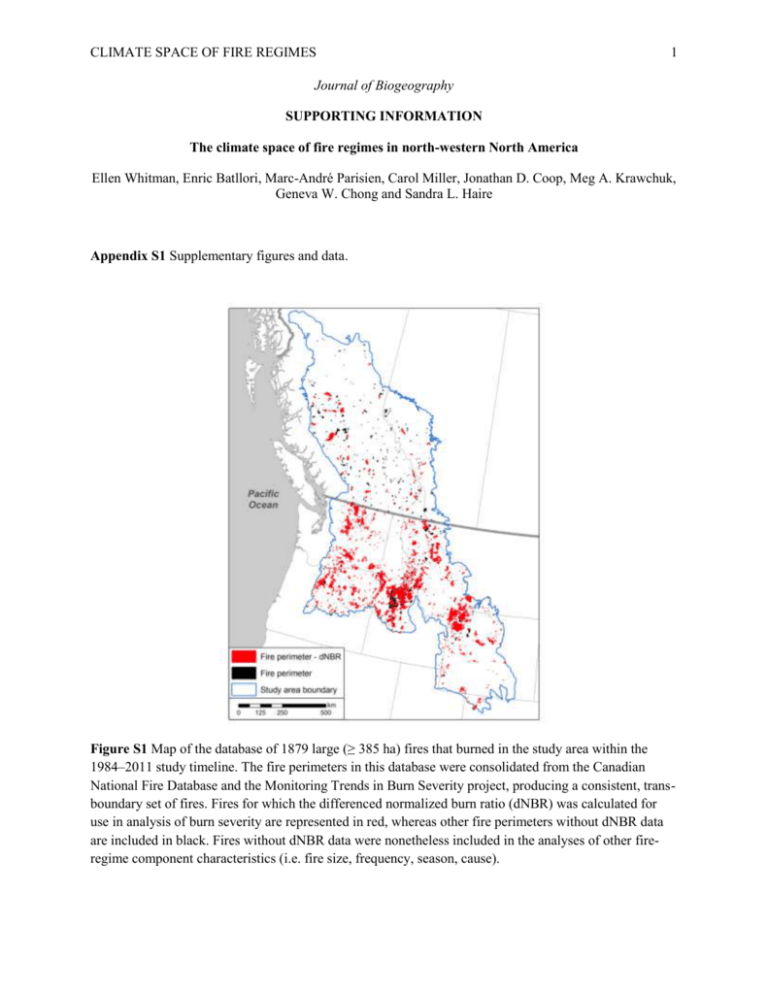
CLIMATE SPACE OF FIRE REGIMES 1 Journal of Biogeography SUPPORTING INFORMATION The climate space of fire regimes in north-western North America Ellen Whitman, Enric Batllori, Marc-André Parisien, Carol Miller, Jonathan D. Coop, Meg A. Krawchuk, Geneva W. Chong and Sandra L. Haire Appendix S1 Supplementary figures and data. Figure S1 Map of the database of 1879 large (≥ 385 ha) fires that burned in the study area within the 1984–2011 study timeline. The fire perimeters in this database were consolidated from the Canadian National Fire Database and the Monitoring Trends in Burn Severity project, producing a consistent, transboundary set of fires. Fires for which the differenced normalized burn ratio (dNBR) was calculated for use in analysis of burn severity are represented in red, whereas other fire perimeters without dNBR data are included in black. Fires without dNBR data were nonetheless included in the analyses of other fireregime component characteristics (i.e. fire size, frequency, season, cause). CLIMATE SPACE OF FIRE REGIMES 2 Table S1 The units and range of the fire-regime components within the climate domains (CDs). Ranges are presented for the 33 CDs where fires occurred, as well as the 24 CDs where ≥ 5 fires occurred, which were used for regression analysis. Frequency is the burned area-weighted number of fires in a CD. Size is the mean fire size in ha. Severity is the mean 90th percentile differenced normalized burn ratio within a CD and season is the median Julian day of fire ignition. Cause is represented by the percentage of all ignitions within the CD caused by lightning. Human footprint index (HFI; Sanderson et al., 2002), although not a fire-regime component, is the mean HFI within the area of a CD. Fire-regime component Frequency Size Severity Season Cause Human footprint index Climate domains with fires Min Max 0.0 0.5 447.5 6069.9 74.8 701 195 265 0 100 0 78 Climate domains ≥ 5 fires Min Max 0.0 0.5 877.9 6069.9 74.8 664.4 196 265 0 92 4.4 35.4 CLIMATE SPACE OF FIRE REGIMES 3 Figure S2 The coefficient of variation (CV) within a climate domain (CD) for fire-regime components of (a) fire size, (b) severity and (c) season. CV within a CD is represented by asterisk size, where larger asterisks indicate more variation within a CD and smaller asterisks indicate a fairly homogenous range of values. Fire size varies substantially within CDs, whereas fire severity and season are more consistent. CDs where < 5 fires occurred during the study timeline are represented in white, and CDs with no fires are represented in grey. CLIMATE SPACE OF FIRE REGIMES 4 Appendix S2 Regressions fitted to climate gradients and fire-regime components. Figure S3 Scatterplots with fitted regressions and deviance explained (DE) for fire-regime components and the dominant climate gradients of the study area. The primary climate gradient of the study area of temperature and summer precipitation is represented as rotated component 1 (RC1) and the secondary climate gradient of continentality and winter precipitation is represented as rotated component 2 (RC2). All regressions presented here are significant at a P ≤ 0.05 level. Units of measurement are average fireregime components within a climate domain, where a climate domain had ≥ 5 fires in 1984–2011. Relationships are: (a) fire frequency as a function of RC1, (b) fire season as a function of RC1, (c) burn severity as a function of RC1, (d) burn severity as a function of RC2, (e) fire cause as a function of RC1, (f) fire cause as a function of RC2, (g) human footprint index (HFI) as a function of RC1 and (h) HFI as a function of RC2. CLIMATE SPACE OF FIRE REGIMES Figure S4 The deviance explained in bivariate regressions between fire-regime components and the fireregime driver of human footprint index (HFI), and the two environmental gradients rotated component 1 (RC1) and rotated component 2 (RC2). RC1 is a gradient of temperature and summer precipitation, whereas RC2 is a gradient of continentality and winter precipitation. The fire-regime components of fire cause and burn severity are strongly predicted by environmental gradients, as is HFI. Fire frequency (Freq), size and season are less driven by the climate gradients in the study area. 5

