display
advertisement
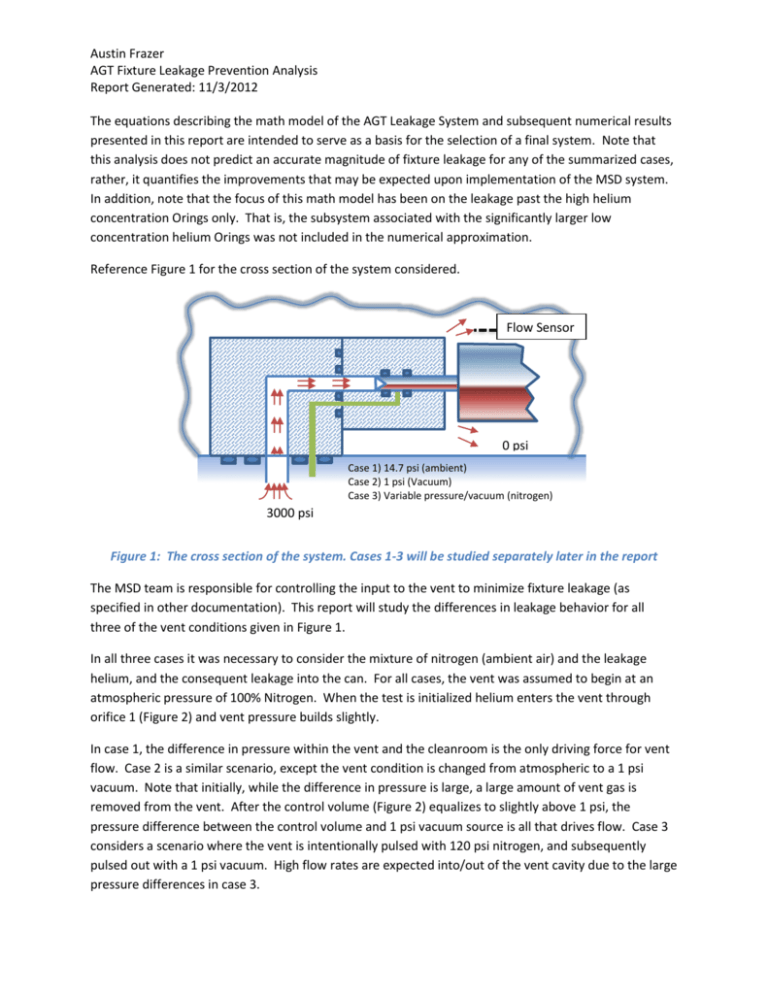
Austin Frazer AGT Fixture Leakage Prevention Analysis Report Generated: 11/3/2012 The equations describing the math model of the AGT Leakage System and subsequent numerical results presented in this report are intended to serve as a basis for the selection of a final system. Note that this analysis does not predict an accurate magnitude of fixture leakage for any of the summarized cases, rather, it quantifies the improvements that may be expected upon implementation of the MSD system. In addition, note that the focus of this math model has been on the leakage past the high helium concentration Orings only. That is, the subsystem associated with the significantly larger low concentration helium Orings was not included in the numerical approximation. Reference Figure 1 for the cross section of the system considered. Flow Sensor 0 psi Case 1) 14.7 psi (ambient) Case 2) 1 psi (Vacuum) Case 3) Variable pressure/vacuum (nitrogen) 3000 psi Figure 1: The cross section of the system. Cases 1-3 will be studied separately later in the report The MSD team is responsible for controlling the input to the vent to minimize fixture leakage (as specified in other documentation). This report will study the differences in leakage behavior for all three of the vent conditions given in Figure 1. In all three cases it was necessary to consider the mixture of nitrogen (ambient air) and the leakage helium, and the consequent leakage into the can. For all cases, the vent was assumed to begin at an atmospheric pressure of 100% Nitrogen. When the test is initialized helium enters the vent through orifice 1 (Figure 2) and vent pressure builds slightly. In case 1, the difference in pressure within the vent and the cleanroom is the only driving force for vent flow. Case 2 is a similar scenario, except the vent condition is changed from atmospheric to a 1 psi vacuum. Note that initially, while the difference in pressure is large, a large amount of vent gas is removed from the vent. After the control volume (Figure 2) equalizes to slightly above 1 psi, the pressure difference between the control volume and 1 psi vacuum source is all that drives flow. Case 3 considers a scenario where the vent is intentionally pulsed with 120 psi nitrogen, and subsequently pulsed out with a 1 psi vacuum. High flow rates are expected into/out of the vent cavity due to the large pressure differences in case 3. Austin Frazer AGT Fixture Leakage Prevention Analysis Report Generated: 11/3/2012 It was immediately assumed that a perfect mixture of gases exists in the vent at all times. The vent was treated as a bulk volume and the leakage past the Orings was modeled by using orifice equations. Reference Figure 2 for the simplified schematic 0 psi (To Mass Spectrometer) 3000 psi Orifice 1 Entire Vent Volume Orifice 2 Orifice 3 Figure 2: The simplified schematic Assumptions: • • • Most Importantly: This is a pressure driven flow – Permeability considerations were made (Parker equations from design review). The leakage rates predicted through the Orings were too small. Perfect gas mixture throughout the volume at all times N2 and He are ideal gases For all cases it was assumed that the vent starts out with 100% N2 concentration at atmospheric pressure. A uniform mixture of He and N2 was added into the vent through the “high pressure orifice” and removed by the “low pressure orifice”. The addition/removal of fluid to/from the vent is case sensitive (see Figure 1) Nomenclature: 𝑚 = mass 𝑚̇ = mass flow rate 𝑛 = moles 𝑛̇ = molar flow rate 𝜌 = fluid density 𝑀𝑊 = fluid molecular weight 𝐴𝑜 = orifice cross sectional area 𝐶𝑑 = orifice coefficient 𝑃𝑣𝑒𝑛𝑡 = vent pressure 𝑃1 = pressure input into the vent 𝑅 = Universal gas constant 𝑅𝑠 = Species specific gas constant 𝑉 = Vent volume 𝑑𝑃 = Delta pressure (either side of an orifice) Austin Frazer AGT Fixture Leakage Prevention Analysis Report Generated: 11/3/2012 General Equations: 𝑑 𝑚 = 𝑚̇𝑡𝑜𝑡 = ∑ 𝑚̇𝑖𝑛 − ∑ 𝑚̇𝑜𝑢𝑡 𝑑𝑡 The mass balance must now be converted to a molar flow balance to account for the mixing of gasses in the vent: 𝑚̇ 𝑀𝑊 𝑛̇ 𝑡𝑜𝑡 = ∑ 𝑛̇ 𝑖𝑛 − ∑ 𝑛̇ 𝑜𝑢𝑡 = 𝑛̇ The molar flow rate of a gas through an orifice may be written as: 𝑛̇ = 𝜌𝐶𝑑 𝐴𝑜 2𝑑𝑃 √ 𝑀𝑊 𝜌 But for multiple species (i.e. helium and nitrogen gas) the molar flow rate of each gas within the control volume must be specified: 𝑛̇ 𝐻𝑒,𝑡𝑜𝑡 = ∑ 𝑛̇ 𝐻𝑒,𝑖𝑛 − ∑ 𝑛̇ 𝐻𝑒,𝑜𝑢𝑡 𝑛̇ 𝑁2,𝑡𝑜𝑡 = ∑ 𝑛̇ 𝑁2,𝑖𝑛 − ∑ 𝑛̇ 𝑁2,𝑜𝑢𝑡 If leakage past both the high and low pressure Orings may be modeled orifice flow, then the molar flow rate of helium and nitrogen into and out of the control volume can be split up as follows: 𝑛̇ 𝑂𝑟𝑖𝑓𝑖𝑐𝑒,𝐻𝑒 = %𝐻𝑒 ∗ 𝜌𝑀𝑖𝑥 𝐶𝑑 𝐴𝑜 2𝑑𝑃 √ 𝑀𝑊𝐻𝑒 𝜌𝑀𝑖𝑥 𝑛̇ 𝑂𝑟𝑖𝑓𝑖𝑐𝑒,𝑁2 = %𝑁2 ∗ 𝜌𝑀𝑖𝑥 𝐶𝑑 𝐴𝑜 2𝑑𝑃 √ 𝑀𝑊𝑁2 𝜌𝑀𝑖𝑥 Where the delta pressure term is the difference between the control volume pressure and the pressure on the other side of the respective orifice. The signum function was applied to the equations to determine whether flow was entering or leaving the control volume. The orifice area, Ao is adjusted for each of the Orings to approximate realistic flow/concentration values based on empirical data. For the vent orifice Ao is simply the area of the vent outlet. Square edge orifices (Cd = 0.6) were assumed throughout the analysis. Note that mixed density of the gas within the control volume calculated using the partial pressures with the ideal gas law. Austin Frazer AGT Fixture Leakage Prevention Analysis Report Generated: 11/3/2012 𝑃𝑝𝑎𝑟𝑡𝑖𝑎𝑙 = 𝜌𝑅𝑠 𝑇 𝜌𝑚𝑖𝑥 = 𝜌= 𝑃𝑝𝑎𝑟𝑡𝑖𝑎𝑙 𝑅𝑠 𝑇 𝑃𝑣𝑒𝑛𝑡 %𝑁2 %𝐻𝑒 ( + ) 𝑇 𝑅𝑁2 𝑅𝐻𝑒 Reference Table 1 on the following page for a summary of relevant system parameters and the associated units. Value Units Notes Patm 101300 Pa N/A T amb 300 K N/A MW He 4 amu N/A MW N2 14 amu N/A Cd 1,2,3 0.6 N/A All orifices Ao (1) 7.51E-15 m^2 Orifice 1 (Figure 2) Ao (2) 7.51E-15 m^2 Orifice 2 (Figure 2) Ao (3) 2.45E-06 m^2 Orifice 3 (Figure 2) V 85 mm^3 N/A Table 1: All relevant system constants, dimensions, and other parameters Simulation/Results: A screenshot of the Simulink block diagram which was constructed per the given equations is given in Figure 3. Note that this block diagram is capable of calculating the helium flow rate and total volume of helium into the can for all three cases. Molar flow rate of He Integrator Molar flow rate of gas into can calculator N2 Integrator Calculates Mixed Density helium into vent (3000 psi) Molar flow rate of gas into/out of vent Calculates % Moles Figure 3: The Simulink block diagram Austin Frazer AGT Fixture Leakage Prevention Analysis Report Generated: 11/3/2012 The plots of Figures 4-6 were generated considering cases 1 and 2. The plots of Figure 4 were generated for the percentage of helium within over time. -3 7 Percentage of Helium In Vent x 10 -6 4.5 Case 1: Ambient Applied Pressure Case 2: Constant 1 psi Vacuum 6 4 Case 1: Ambient Applied Pressure Case 2: Constant 1 psi Vacuum 3.5 % Helium In Vent 5 % Helium In Vent Percentage of Helium In Vent x 10 4 3 2 3 2.5 2 1.5 1 1 0 0.5 0 50 100 150 200 Time (seconds) 250 300 350 0 400 0 0.2 0.4 0.6 0.8 1 1.2 Time (seconds) 1.4 1.6 1.8 2 Figure 4: A comparison of the helium percentages in the vent for the (left) full test duration (right) “beneficial zone” of case 2 Upon inspection of the plot to the left of Figure 4 it is seen that when a vacuum is pulled over the entire test duration, the % of helium within the vent is able to grow at a faster rate. The beneficial region of pulling a vacuum is only seen when the pressure difference between the vent and the vacuum source is large. With the given parameters, this has been calculated to be about 2 seconds (plot to the right of Figure 4). Similar results may be expected for the volume of leakage helium vs time plots of Figure 5. -6 2.5 -11 Comparison of Cases 1 and 2 x 10 1.2 Case 1: Ambient Applied Pressure Case 2: Constant 1 psi Vacuum Volume of Leakage He (cc) Volume of Leakage He (cc) 1.5 1 0.5 0 Case 1: Ambient Applied Pressure Case 2: Constant 1 psi Vacuum 1 2 Beneficial Range of Case 3 x 10 0.8 0.6 0.4 0.2 0 50 100 150 200 Time (seconds) 250 300 350 400 0 0 0.5 1 1.5 2 2.5 Time (seconds) Figure 5: A comparison of the helium leakage volume into the AGT can for the (left) full test duration , and (right) “beneficial zone” of case 2. It has been concluded that pulling a constant vacuum within the vent will not aid in reducing AGT fixture leakage. For further discussion of this somewhat counter-intuitive phenomena reference the final MSD I detail design review powerpoint posted on the EDGE website. Austin Frazer AGT Fixture Leakage Prevention Analysis Report Generated: 11/3/2012 Case 3 is now taken into consideration. For the methodology of determining a pulse/purge duty cycles (presented in Table 2) and a detailed explanation of the case 3 concept refer to the powerpoint posted on the EDGE website. Only results for case 3 will be presented in this report. Period (s) Duty Cycle (%) 10 20 20 10 30 6.7 40 5 Table 2: The pulse/purge periods and duty cycles considered within the simulateion. Duty cycles were calculated considering the 2 second “beneficial vacuum” time calculated in case 2. The plots of Figures 6 and 7 depict the volumetric flow rate of helium into the can and total volume of helium leaked into the can respectively. Results are provided for several simulations in which differing pulse/purge cycle periods and duty cycles were input into the model. -13 7 Period = Period = Period = Period = 6 He Can Leakage (cc/s) Volumetric Flow Rate of Helium into Can Over Time x 10 5 4 10 s 20 s 30 s 40 s 3 2 1 0 0 50 100 150 200 250 Time (seconds) 300 350 Figure 6: Case 3 volumetric flow rate of helium into the can over time 400 Austin Frazer AGT Fixture Leakage Prevention Analysis Report Generated: 11/3/2012 -10 He Can Leakage Volume (cc) He Can Leakage Volume Over Time x 10 1.4 1.2 Period = Period = Period = Period = 1 0.8 10 s 20 s 30 s 40 s 0.6 0.4 0.2 0 0 50 100 150 200 250 Time (seconds) 300 350 400 Figure 7: Case 3 total leaked volume vs time for several pulse/purge periods and duty cycles The plot of the % helium in the vent for the 10 second pulse/purge period is provided in Figure 8: -7 1.6 % Helium For a 10 Second Pulse Purge Period x 10 1.4 1.2 % Helium 1 0.8 0.6 0.4 0.2 0 0 50 100 150 200 Time (seconds) 250 300 350 400 Figure 8: the % Helium in the vent for the 10 second pulse/purge period Finally a comparison between the baseline case 1 and case 3 is provided in Figure 9. It is seen that a significant improvement may be expected upon implementation of the case 3 system. Austin Frazer AGT Fixture Leakage Prevention Analysis Report Generated: 11/3/2012 -11 He Can Leakage (cc/s) 1 Volumetric Flow Rate of Helium into the Can Over Time x 10 Case 3 Case 1 (Baseline) 0.8 0.6 0.4 0.2 0 0 50 100 150 200 250 Time (seconds) 300 350 400 Figure 9: The comparison of the helium leakage into can for the baseline (case 1) and case 3.
