Output from Minitab 17 for Confidence Intervals and Hypothesis
advertisement
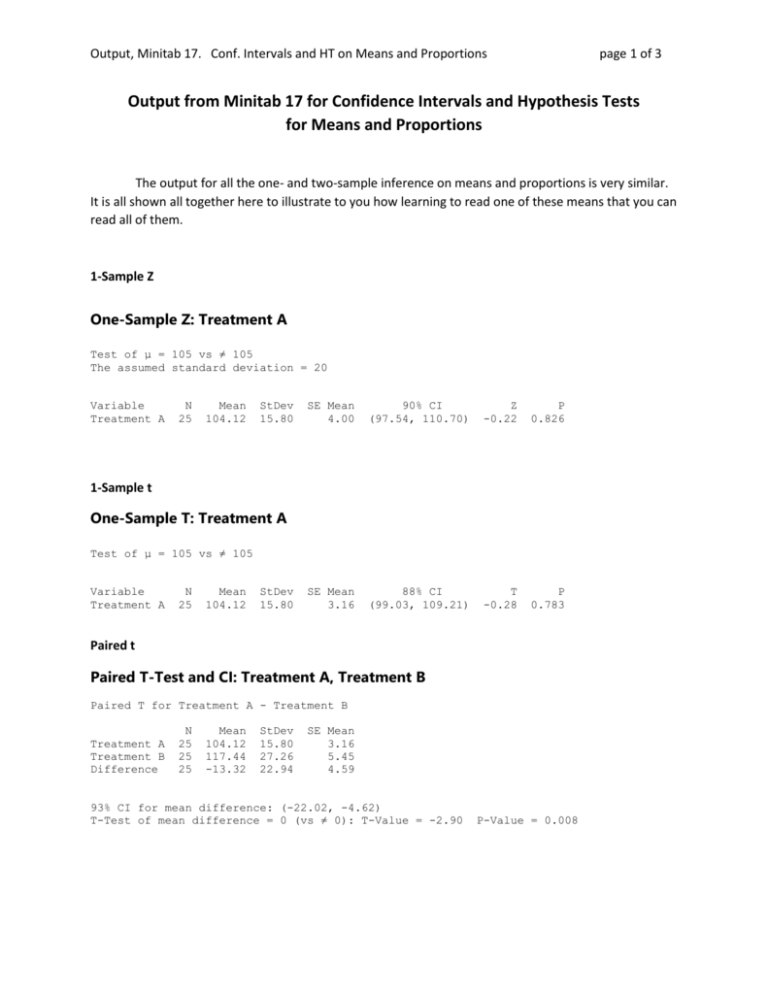
Output, Minitab 17. Conf. Intervals and HT on Means and Proportions page 1 of 3 Output from Minitab 17 for Confidence Intervals and Hypothesis Tests for Means and Proportions The output for all the one- and two-sample inference on means and proportions is very similar. It is all shown all together here to illustrate to you how learning to read one of these means that you can read all of them. 1-Sample Z One-Sample Z: Treatment A Test of μ = 105 vs ≠ 105 The assumed standard deviation = 20 Variable Treatment A N 25 Mean 104.12 StDev 15.80 SE Mean 4.00 90% CI (97.54, 110.70) Z -0.22 P 0.826 SE Mean 3.16 88% CI (99.03, 109.21) T -0.28 P 0.783 1-Sample t One-Sample T: Treatment A Test of μ = 105 vs ≠ 105 Variable Treatment A N 25 Mean 104.12 StDev 15.80 Paired t Paired T-Test and CI: Treatment A, Treatment B Paired T for Treatment A - Treatment B Treatment A Treatment B Difference N 25 25 25 Mean 104.12 117.44 -13.32 StDev 15.80 27.26 22.94 SE Mean 3.16 5.45 4.59 93% CI for mean difference: (-22.02, -4.62) T-Test of mean difference = 0 (vs ≠ 0): T-Value = -2.90 P-Value = 0.008 Output, Minitab 17. Conf. Intervals and HT on Means and Proportions page 2 of 3 2-Sample t Two-Sample T-Test and CI: Treatment E, Group Two-sample T for Treatment E Group C T N 8 10 Mean 20.00 19.00 StDev 3.16 3.53 SE Mean 1.1 1.1 Difference = μ (C) - μ (T) Estimate for difference: 1.00 95% CI for difference: (-2.37, 4.37) T-Test of difference = 0 (vs ≠): T-Value = 0.63 P-Value = 0.536 One Proportion Test and CI for One Proportion Test of p = 0.4 vs p ≠ 0.4 Sample 1 X 67 N 160 Sample p 0.418750 96% CI (0.338647, 0.498853) Using the normal approximation. Z-Value 0.48 P-Value 0.628 DF = 15 Output, Minitab 17. Conf. Intervals and HT on Means and Proportions page 3 of 3 Two Proportions This is estimating the two proportions separately (appropriate for confidence interval.) Test and CI for Two Proportions Sample 1 2 X 32 39 N 83 90 Sample p 0.385542 0.433333 Difference = p (1) - p (2) Estimate for difference: -0.0477912 85% CI for difference: (-0.155348, 0.0597661) Test for difference = 0 (vs ≠ 0): Z = -0.64 P-Value = 0.522 Fisher’s exact test: P-Value = 0.540 This is using the pooled estimate of the two proportions (appropriate for hypothesis test.) Test and CI for Two Proportions Sample 1 2 X 32 39 N 83 90 Sample p 0.385542 0.433333 Difference = p (1) - p (2) Estimate for difference: -0.0477912 85% CI for difference: (-0.155348, 0.0597661) Test for difference = 0 (vs ≠ 0): Z = -0.64 P-Value = 0.523 Fisher’s exact test: P-Value = 0.540 Note that the different choices about how to estimate the two proportions give very similar results here. Partly that is because the sample proportions were not very far apart in this case. But mostly it is because these two methods almost always give very similar results. The reason for the two different methods is theoretical. The extra assumption during hypothesis testing that the two proportions are equal implies that you should have equal estimates. That means you combine all the information in both samples when you use that information to estimate the standard error in the denominator of the z-statistic. That’s why we use the pooled estimate of the proportions when doing hypothesis testing.
