Layers of the Atmosphere.PDF
advertisement
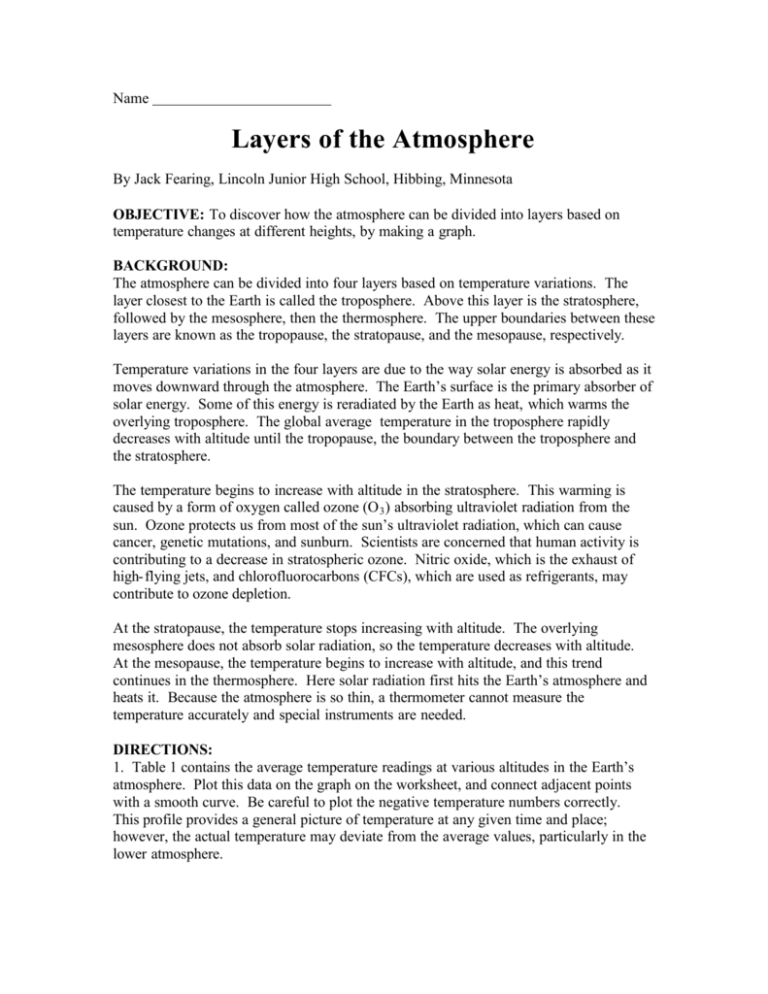
Name Layers of the Atmosphere By Jack Fearing, Lincoln Junior High School, Hibbing, Minnesota OBJECTIVE: To discover how the atmosphere can be divided into layers based on temperature changes at different heights, by making a graph. BACKGROUND: The atmosphere can be divided into four layers based on temperature variations. The layer closest to the Earth is called the troposphere. Above this layer is the stratosphere, followed by the mesosphere, then the thermosphere. The upper boundaries between these layers are known as the tropopause, the stratopause, and the mesopause, respectively. Temperature variations in the four layers are due to the way solar energy is absorbed as it moves downward through the atmosphere. The Earth’s surface is the primary absorber of solar energy. Some of this energy is reradiated by the Earth as heat, which warms the overlying troposphere. The global average temperature in the troposphere rapidly decreases with altitude until the tropopause, the boundary between the troposphere and the stratosphere. The temperature begins to increase with altitude in the stratosphere. This warming is caused by a form of oxygen called ozone (O 3 ) absorbing ultraviolet radiation from the sun. Ozone protects us from most of the sun’s ultraviolet radiation, which can cause cancer, genetic mutations, and sunburn. Scientists are concerned that human activity is contributing to a decrease in stratospheric ozone. Nitric oxide, which is the exhaust of high- flying jets, and chlorofluorocarbons (CFCs), which are used as refrigerants, may contribute to ozone depletion. At the stratopause, the temperature stops increasing with altitude. The overlying mesosphere does not absorb solar radiation, so the temperature decreases with altitude. At the mesopause, the temperature begins to increase with altitude, and this trend continues in the thermosphere. Here solar radiation first hits the Earth’s atmosphere and heats it. Because the atmosphere is so thin, a thermometer cannot measure the temperature accurately and special instruments are needed. DIRECTIONS: 1. Table 1 contains the average temperature readings at various altitudes in the Earth’s atmosphere. Plot this data on the graph on the worksheet, and connect adjacent points with a smooth curve. Be careful to plot the negative temperature numbers correctly. This profile provides a general picture of temperature at any given time and place; however, the actual temperature may deviate from the average values, particularly in the lower atmosphere. TABLE 1 Average Temperature Readings at Various Altitudes Altitude (km) 0 5 10 12 20 25 30 35 40 45 48 Temp (o C) 15 -18 -49 -56 -56 -51 -46 -37 -22 -8 -2 Altitude (km) 52 55 60 65 70 75 80 84 92 95 100 Temp (o C) -2 -7 -17 -33 -54 -65 -79 -86 -86 -81 -72 2. Label the different layers of the atmosphere and the separating boundaries between each layer. 3. Mark the general location of the ozone layer. You should place eight words on your graph in the correct locations: troposphere, tropopause, stratosphere, stratopause, mesosphere, mesopause, thermosphere and ozone layer. QUESTIONS: 1. What is the basis for dividing the atmosphere into four layers? 2. Does the temperature increase or decrease with altitude in the: troposphere? stratosphere? mesosphere? thermosphere? 3. What is the approximate height and temperature of the: tropopause: stratopause: mesopause: 4. What causes the temperature to increase with height through the stratosphere, and decrease with height through the mesosphere? 5. What causes the temperature to decrease with height in the troposphere? Graph of Temperature at Various Altitudes ALTITUDE (km above sea level – Y-axis) 100 95 90 85 80 75 70 65 60 55 50 45 40 35 30 25 20 15 10 5 0 -100 -90 -80 -70 -60 -50 -40 -30 Temperature (o C) -20 -10 -5 0 10 20
