IT Showcase On: Microsoft Business Intelligence
Quick Reference Guide
Measuring and Driving Microsoft IT Using Microsoft Business Intelligence Solutions
The following content may no longer reflect Microsoft’s current position or infrastructure. This content should be viewed as reference documentation only, to inform IT business decisions within your
own company or organization.
driving the right activities to ensure successful execution of
EXECUTIVE OVERVIEW
Microsoft BI technologies:
our strategies.” Microsoft CIO
Microsoft IT uses BI to strengthen business partnerships
Scorecards - Microsoft SQL Server Reporting Services,
and connect the company. BI tools such as the CIO
When combined with Strategy/Balanced Scorecard
Microsoft SharePoint 2013 PerformancePoint Services
Scorecard, Business Partner Scorecards, and Pro Forma
methodology, BI scorecards provide a fast and effective
Dashboards - Microsoft SQL Server Reporting Services,
Invoice help us to measure business success and the
visual reference for leaders to drive and manage Key
Microsoft SharePoint PerformancePoint Services
performance of the organization. Innovative business
Performance Indicators (KPI) within the business, and help
Analytics - PowerPivot for Microsoft Excel, SQL Server
dashboards and analytics such as the internal Focus system
to empower business decisions. KPIs are the specific
Analysis Services, Power View
help the organization to spot trends and enable rapid
measurements that can be comparatively analyzed to
BUSINESS CAPABILITIES OF BI SCORECARDS
business decisions.
determine the success of the business.
WHAT IS MICROSOFT BUSINESS INTELLIGENCE?
Microsoft Business Intelligence (BI) is a broad category of
applications and technologies for gathering, storing,
analyzing, and providing access to data to help enterprise
users make better business decisions. Powerful self-service
capabilities integrated into familiar tools enable users to
create and share the right information quickly. BI helps
Microsoft IT make informed decisions about millions of
data points in a fast-paced and intuitive manner,
capitalizing on real-time analytics and better-together
system integration through Microsoft products and
technologies.
Within Microsoft IT, the CIO Scorecard Platform improves
the organization by providing business insights to all
employees, leading to better, faster, more
relevant decisions.
BUSINESS INTELLIGENCE DASHBOARDS
Dashboards offer real-time drill-through analytics and up-tothe-minute business analysis of KPI using familiar
performance gauge and chart visualizations.
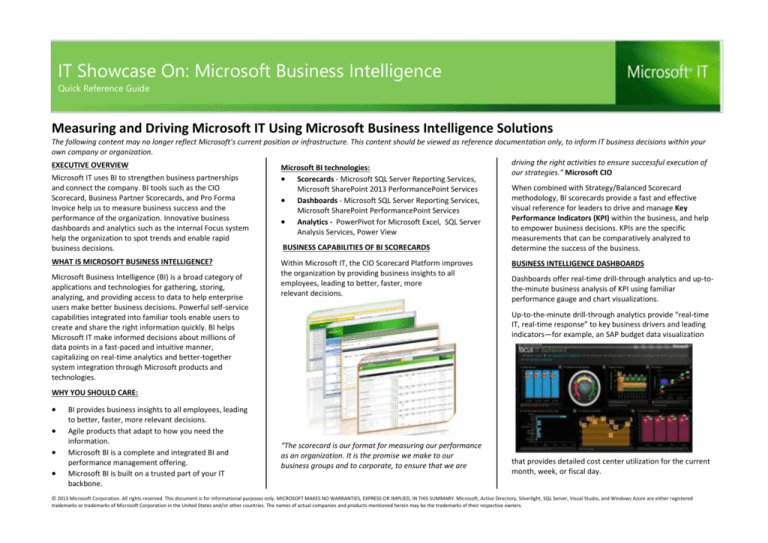
Up-to-the-minute drill-through analytics provide “real-time
IT, real-time response” to key business drivers and leading
indicators—for example, an SAP budget data visualization
WHY YOU SHOULD CARE:
BI provides business insights to all employees, leading
to better, faster, more relevant decisions.
Agile products that adapt to how you need the
information.
Microsoft BI is a complete and integrated BI and
performance management offering.
Microsoft BI is built on a trusted part of your IT
backbone.
“The scorecard is our format for measuring our performance
as an organization. It is the promise we make to our
business groups and to corporate, to ensure that we are
that provides detailed cost center utilization for the current
month, week, or fiscal day.
© 2013 Microsoft Corporation. All rights reserved. This document is for informational purposes only. MICROSOFT MAKES NO WARRANTIES, EXPRESS OR IMPLIED, IN THIS SUMMARY. Microsoft, Active Directory, Silverlight, SQL Server, Visual Studio, and Windows Azure are either registered
trademarks or trademarks of Microsoft Corporation in the United States and/or other countries. The names of actual companies and products mentioned herein may be the trademarks of their respective owners.
Dashboards provide users a view of “where we are RIGHT
NOW” with project schedule performance for the
organization, a specific team, an individual, or for a given
project.
Drill-through capabilities from high-level scorecard
measures against performance targets to dashboards, and
detailed row-level analytics help MSIT leadership move
quickly from high-level measures to the details and respond
in real time to KPIs sliding off-target. Data slicers help to
further narrow the focus to specific data sets quickly and
visually, helping to drive faster and more effective business
decisions.
BI CAPABILITIES PROVIDE AN ANALYTICS POWERHOUSE
Microsoft built analytic capabilities into the tools that the
business already uses day in and day out, including SSAS,
Excel PowerPivot, and SharePoint PPS.
Business analytics advantages include data set
correlation, predictive modeling, and factor
regression.
Self-service analytics give every employee the power
to build BI analytics, reports, dashboards, etc., without
requiring sophisticated technical skills using
PowerPivot, Power View, SharePoint Analytics, and
SQL Report Writer.
Data visualizations provide the ability to see
correlations and relationships in a faster and more
user-intuitive manner.
Data animations in technologies such as Power View
and Pivot Viewer allow business users to see concepts
play over time dimensions, like a small animated
movie.
View, and results can be shared SharePoint. Excel 2013, is a
complete and powerful self-service BI tool.
SELF-SERVICE ANALYSIS IN POWERPIVOT
Users can transform mass quantities of data with incredible
speed into meaningful information to get the answers they
need. With PowerPivot, they are able to process large data
sets (often millions of rows) with about the same
performance as processing a few hundred rows by
leveraging the PowerPivot in-memory engine and its
efficient compression algorithms.
PowerPivot users can integrate data from a multitude of
sources, including corporate databases, spreadsheets,
reports, text files, and Internet data feeds, move beyond
standard Excel expressions, and use PowerPivot’s Data
Analysis Expressions (DAX) language to perform powerful
data manipulations:
SHARE AND COLLABORATE THROUGH SHAREPOINT
Seamless integration with Office SharePoint Server 2013
provides the ideal environment to help users collaborate and
share insights across the organization. It makes it easier to
locate and collaborate with people who have the knowledge
and expertise needed.
INTERACTIVE DATA VISUALIZATION IN POWER VIEW
Information can be published to SharePoint instantly, with a
single click, and share through interactive PowerPivot
workbooks and Power View reports that enhance
collaboration and communicate business insights.
Power View enables the creation of rich, interactive data
visualizations and makes self-service reporting a reality,
with highly interactive, browser-based data exploration;
visualization; and presentation for users of all levels—from
business executives to information workers.
With SharePoint, reports and analytical applications can be
kept up-to-date by scheduling automatic data refreshes for
workbooks. Alerts can also be defined to proactively notify
the user when data has changed. Alert rules can be easily
customized and managed by each user.
BENEFITS OF BUSINESS INTELLIGENCE
Empowering the workforce. Empower users to collaborate,
discover, and manage their aspect of the business with the
right information to make better, more agile decisions. By
using familiar tools to create and share the right information,
users are able to drive the business forward by responding in
a timely fashion and taking advantage of opportunities as
they arise.
Global dissemination though SharePoint, data, and
management KPI can be deployed immediately to a
global community.
MICROSOFT EXCEL 2013: A POWERFUL SELF-SERVICE BI
TOOL
The Self-service BI tool of choice is Excel 2013. Data can be
imported from a variety of sources, cleaned up through
built-in tools, extended by using PowerPivot, explored
through pivot tables and charts, visualized it through Power
Some of the visualization available in Power View include:
•
Drag and drop, user-defined drill paths
•
Wide variety of data visualizations
•
“What-if”–type analysis with filtering
•
Save or export multiple views to PowerPoint
•
Geospatial mapping
With Power View, users can easily create and interact with
views of data from tabular models based on PowerPivot
workbooks or deployed to SSAS instances.
Improving organizational effectiveness. Manage, drive, and
define organizational success by aligning to key metrics and
strategy, creating context-driven dashboards that present
the necessary information quickly and seamlessly. Measure
the critical success factors and enable everyone to create
and analyze the information they need to stay informed and
move the business forward. Enable accountability and
transparency across the company, and remove barriers to
productivity.
© 2013 Microsoft Corporation. All rights reserved. This document is for informational purposes only. MICROSOFT MAKES NO WARRANTIES, EXPRESS OR IMPLIED, IN THIS SUMMARY. Microsoft, Active Directory, Silverlight, SQL Server, Visual Studio, and Windows Azure are either registered
trademarks or trademarks of Microsoft Corporation in the United States and/or other countries. The names of actual companies and products mentioned herein may be the trademarks of their respective owners.
Enabling IT efficiency. Provide a complete, integrated
business collaboration platform that empowers users to
discover, analyze, and share the right information across
unstructured assets such as blogs, wikis, and documents;
and structured assets such as reports, lines of business, and
analytical systems. Built on standards, IT can address
business requirements by putting information in the hands
of users, focusing on developing, maintaining and securing
the systems that drive the business forward and centrally
manage the system.
EDUCATION RESOURCES
Microsoft BI
www.microsoft.com/bi
Introduction to Microsoft Business Intelligence
http://msdn.microsoft.com/en-us/sql10r2byfbitrainingcourse_sql10r2byfbi00_unit.aspx
Business Intelligence TechCenter
http://technet.microsoft.com/en-us/bi/default.aspx
Microsoft PowerPivot
www.powerpivot.com
SQL Server Business Intelligence
http://www.microsoft.com/en-us/sqlserver/solutionstechnologies/business-intelligence.aspx
What's new in Business Intelligence in SharePoint
Server 2013
http://technet.microsoft.com/enus/library/jj542395.aspx
Learning Center Business Intelligence
http://www.microsoft.com/enus/bi/LearningCenter/BIVideos.aspx
© 2013 Microsoft Corporation. All rights reserved. This document is for informational purposes only. MICROSOFT MAKES NO WARRANTIES, EXPRESS OR IMPLIED, IN THIS SUMMARY. Microsoft, Active Directory, Silverlight, SQL Server, Visual Studio, and Windows Azure are either registered
trademarks or trademarks of Microsoft Corporation in the United States and/or other countries. The names of actual companies and products mentioned herein may be the trademarks of their respective owners.


