MATH 612 --RR Explorations
advertisement
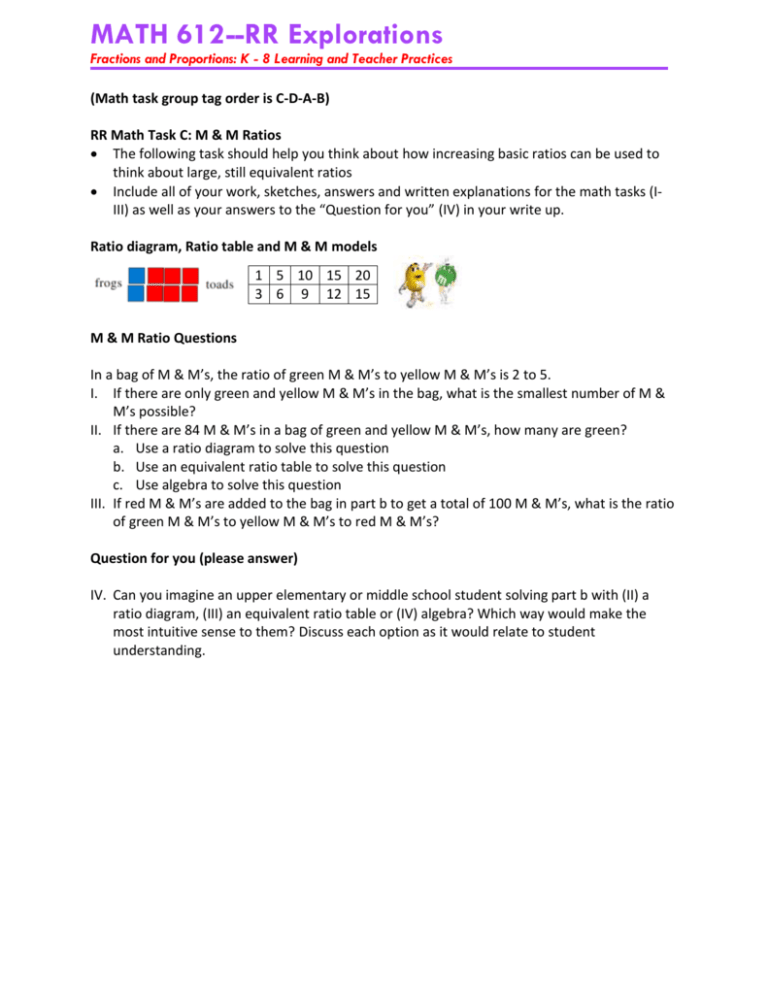
MATH 612 --RR Explorations Fractions and Proportions: K - 8 Learning and Teacher Practices (Math task group tag order is C-D-A-B) RR Math Task C: M & M Ratios The following task should help you think about how increasing basic ratios can be used to think about large, still equivalent ratios Include all of your work, sketches, answers and written explanations for the math tasks (IIII) as well as your answers to the “Question for you” (IV) in your write up. Ratio diagram, Ratio table and M & M models 1 5 10 15 20 3 6 9 12 15 M & M Ratio Questions In a bag of M & M’s, the ratio of green M & M’s to yellow M & M’s is 2 to 5. I. If there are only green and yellow M & M’s in the bag, what is the smallest number of M & M’s possible? II. If there are 84 M & M’s in a bag of green and yellow M & M’s, how many are green? a. Use a ratio diagram to solve this question b. Use an equivalent ratio table to solve this question c. Use algebra to solve this question III. If red M & M’s are added to the bag in part b to get a total of 100 M & M’s, what is the ratio of green M & M’s to yellow M & M’s to red M & M’s? Question for you (please answer) IV. Can you imagine an upper elementary or middle school student solving part b with (II) a ratio diagram, (III) an equivalent ratio table or (IV) algebra? Which way would make the most intuitive sense to them? Discuss each option as it would relate to student understanding. MATH 612 --RR Explorations Fractions and Proportions: K - 8 Learning and Teacher Practices RR Math Task D: Jelly Bean Ratios The following task should help you think about the interaction of equivalent ratios (a multiplicative relationship) and how addition and subtraction changes this equivalence Include all of your work, sketches, answers and written explanations for the math tasks (I) as well as your answers to the “Question for you” (II) in your write up. Ratio diagram, Ratio table and Jelly Bean models 1 5 10 15 20 3 6 9 12 15 Jelly Bean Ratio Questions For the following question: I. The ratio of red jelly beans to yellow jelly beans in a dish is 3 to 4. If Greg eats 3 red jelly beans and 6 yellow jelly beans, the ratio of red jelly beans to yellow jelly beans is now 4 to 5. How many red and how many yellow jelly beans were originally in the dish? a. Use a ratio diagram to solve this question b. Use an equivalent ratio table to solve this question c. Use algebra to solve this question Question for you (please answer) II. Can you imagine an upper elementary or middle school student solving this question with (I) a ratio diagram, (II) an equivalent ratio table or (III) algebra? Which way would make the most intuitive sense to them? Discuss each option as it would relate to student understanding? MATH 612 --RR Explorations Fractions and Proportions: K - 8 Learning and Teacher Practices RR Math Task A: The Bike Ride The following task should help you think about basic rates, how the relate to basic line graphs and how the units involved with the rates are reflected in the graphs Include all of your work, sketches, answers and written explanations for the math tasks (IIV) as well as your answers to the “Question for you” (V) in your write up. Ratio table and Bike models with a Graph 1 5 10 15 20 3 6 9 12 15 Bike Ride Questions I. Sally rode her bike from her house, at a constant rate, 7 ½ miles to her friend’s house. She left at 10 a.m. and arrived at 11:20 a.m. How fast did Sally ride on the way to her friend’s house? II. Sally rode her bike from her friend’s house, at a constant rate, on the return trip to her house, but went ½ mile out of her way (total) to see a nice view. Her return trip took 90 minutes. How fast did Sally ride on her return trip? III. Graph both journeys on the same grid with the horizontal axis time and the vertical axis total distance traveled from Sally’s house. IV. Compare Sally’s two speeds, for which direction did she go faster? How can you tell by looking at the graph? Question for you (please answer) V. How are these questions related to rates, and how is this reelected in the graphs? Discuss in detail. MATH 612 --RR Explorations Fractions and Proportions: K - 8 Learning and Teacher Practices RR Math Task B: Chickens and Eggs The following task should help you think about how ratios and rates work together, and the importance of using units to help guide your thinking. Include all of your work, sketches, answers and written explanations for the math tasks (I) as well as your answers to the “Questions for you” (II-III) in your write up. Ratio diagram, Ratio table and Chicken models 1 5 10 15 20 3 6 9 12 15 Chicken and Egg Question I. If a dozen hens lay a dozen eggs in a dozen days, how many eggs do 108 hens lay in 108 days? Explain your solution fully. Questions for you (please answer) II. Now that you have an answer, can you use a different method to solve the question? Use a different method from algebra, an equivalent ratio table, a ratio diagram or a different method to show the solution path a different way. III. How do your solution relate to ratios? Does increasing a triple ratio here (e.g., 1:2:3 is equivalent to 2:4:6) work in this case? Why or why not? How does this relate to rates?
