Overview - Connecticut Core Standards
advertisement
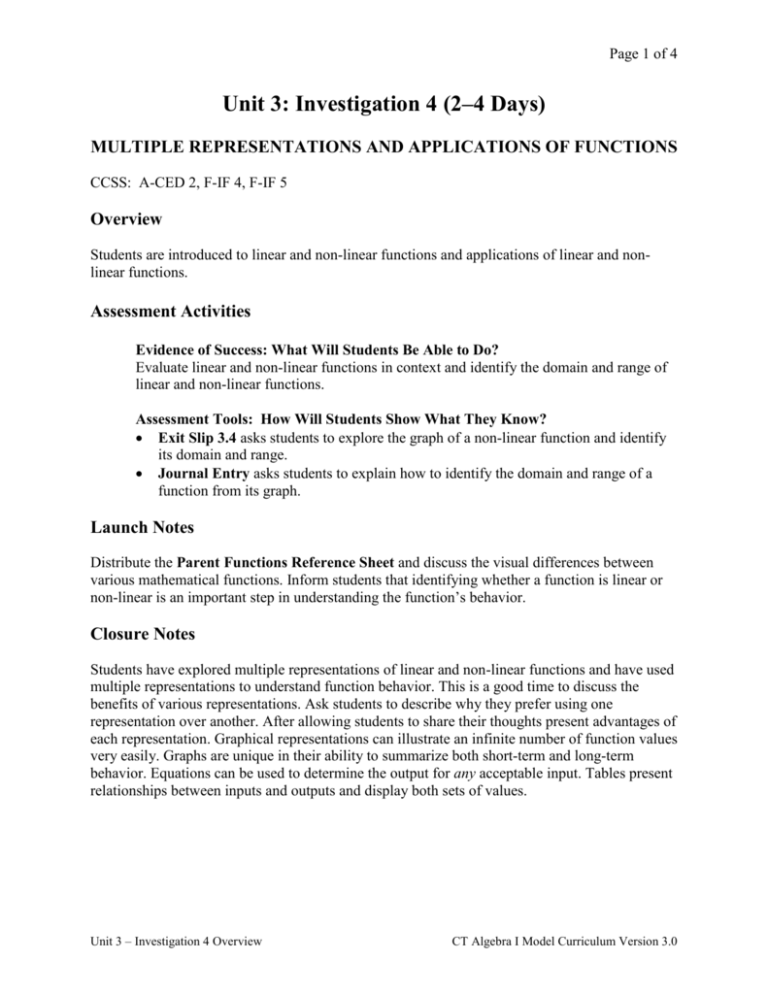
Page 1 of 4 Unit 3: Investigation 4 (2–4 Days) MULTIPLE REPRESENTATIONS AND APPLICATIONS OF FUNCTIONS CCSS: A-CED 2, F-IF 4, F-IF 5 Overview Students are introduced to linear and non-linear functions and applications of linear and nonlinear functions. Assessment Activities Evidence of Success: What Will Students Be Able to Do? Evaluate linear and non-linear functions in context and identify the domain and range of linear and non-linear functions. Assessment Tools: How Will Students Show What They Know? Exit Slip 3.4 asks students to explore the graph of a non-linear function and identify its domain and range. Journal Entry asks students to explain how to identify the domain and range of a function from its graph. Launch Notes Distribute the Parent Functions Reference Sheet and discuss the visual differences between various mathematical functions. Inform students that identifying whether a function is linear or non-linear is an important step in understanding the function’s behavior. Closure Notes Students have explored multiple representations of linear and non-linear functions and have used multiple representations to understand function behavior. This is a good time to discuss the benefits of various representations. Ask students to describe why they prefer using one representation over another. After allowing students to share their thoughts present advantages of each representation. Graphical representations can illustrate an infinite number of function values very easily. Graphs are unique in their ability to summarize both short-term and long-term behavior. Equations can be used to determine the output for any acceptable input. Tables present relationships between inputs and outputs and display both sets of values. Unit 3 – Investigation 4 Overview CT Algebra I Model Curriculum Version 3.0 Page 2 of 4 Teaching Strategies This investigation consists of a set of activities which can be implemented in any order. You are encouraged to select activities that best serve your students and do not have to do all of them. First distribute the Parent Functions Reference Sheet. This sheet shows the graphs of a variety of functions and is referenced by many activities in this investigation. It exposes students to functions they will encounter later in this course and in subsequent courses. We do not expect students to obtain a thorough knowledge of these functions at this point, but rather to have an appreciation of the fact that functions come in many forms. I. Linear Functions: In Activity 3.4.1a Highway Driving, students construct a function, find values of the independent and dependent variables, identify its domain and range, and represent the function as a table and graph. Differentiated Instruction (For Learners Needing More Help) Activity 3.4.1b Highway Driving is identical to Activity 3.4.1a Highway Driving but the input and output variables in the table are identified and the axes are labeled and scaled. II. Reciprocal Functions: In Activity 3.4.2 Travel Time, students construct a function, find values of the independent and dependent variables, identify its domain and range, and represent the function as a table and graph. III. Linear Functions: In Activity 3.4.3 Free Throws, students construct a function, find values of the independent and dependent variables, identify its domain and range, and represent the function as a table and graph. IV. Quadratic Functions: In Activity 3.4.4a Height of a Ball, students convert an equation to a function, find values of the independent and dependent variables, identify its domain and range, and represent the function as a table and graph. Differentiated Instruction (For Learners Needing More Help) Activity 3.4.4b Height of a Ball is identical to Activity 3.4.4a Height of a Ball but the output values are already filled in the table and the axes are labeled and scaled. V. Cubic Functions: In Activity 3.4.5 Volume of a Cube, students construct a function, interpret the function, identify its domain and range, and represent the function as a table and graph. VI. Exponential Functions: In Activity 3.4.6 Phone Tree, students convert an equation to a function, interpret the function, identify its domain and range, and represent the function as a table and graph. Unit 3 – Investigation 4 Overview CT Algebra I Model Curriculum Version 3.0 Page 3 of 4 VII. Quadratic Function: In Activity 3.4.7 Handshakes, students explore the handshake problem by collecting data on the number of handshakes possible for groups of different sizes. Have students form groups of two to six students, and have them carefully keep track of the total number of handshakes that are possible. Students will recognize that the number of handshakes is a function of the size of the group. Students can create tables to organize their results. After giving students sufficient time to search for a pattern, pose appropriate questions to tease out the function 𝑓(𝑛) = 𝑛(𝑛 − 1)/2, where f(n) is the total number of handshakes and n is the number of people in the group. You may have students graph this function for values of n from 0 through 8. Students should identify the domain of the function as the set of positive integers. VIII. Square Root Function: In Activity 3.4.8 Geoboard Squares, geoboards are used to develop the concept of square root as the length of the side of a square with a particular area. The eight different sizes of squares that can be constructed on a 5 by 5 geoboard (or dot paper grid) include four with integral square roots (1, 4, 9, and 16 square units) and four with irrational square roots (2, 5, 8, and 10 square units). Students make a table, graph the data, and discover the shape of the square root function. Note: the performance task is based on a square root function so you may definitely want to include this activity. Group Work Separate the class into groups to complete Activity 3.4.7 Handshakes or Activity 3.4.8 Geoboard Squares. IX. Identifying Functions: You may choose to show the video The Wind Business (5.55 minutes) at: http://www.thefutureschannel.com/movies/environmental_movies.php, and have the students create a list of the functions described in the video. The examples that students may cite are: Faster wind speed generates more electricity, the larger the rotors the greater the amount of electricity generated. X. Cubic Function: Distribute the Powermills activity provided at http://www.thefutureschannel.com/pdf/algebra/powermills.pdf. Since power in watts is a cubic function of wind velocity, students may explore the special function defined by 𝑃 = 𝑘𝑤 3 . Students solve for the parameter k in the equation 𝑃 = 𝑘𝑤 3 given a table of values for P and w. Differentiated Instruction (Enrichment) Step Function: In Activity 3.4.9 U.S. Postal Service Rates, students explore a step function by investigating the relationship between postage charges and weights of large envelopes. Students are presented a table and asked to evaluate the function. The function is then graphed and students interpret the meaning of open and closed circles in the graph of a step function. Unit 3 – Investigation 4 Overview CT Algebra I Model Curriculum Version 3.0 Page 4 of 4 Journal Entry Explain how to identify the domain and range of a function from its graph. Resources and Materials Unit 3 Parent Functions Reference Sheet Activities 3.4.1a – Highway Driving Activities 3.4.1b – Highway Driving Activities 3.4.2 – Travel Time Activities 3.4.3 – Free Throws Activities 3.4.4a – Height of a Ball Activities 3.4.4b – Height of a Ball Activities 3.4.5 – Volume of a Cube Activities 3.4.6 – Phone Tree Activities 3.4.7 – Handshakes Activities 3.4.8 – Geoboard Squares Activities 3.4.9 – U.S. Postal Service Rates Exit Slip 3.4 – Hot Air Balloon Bulletin board for key concepts Student journals Environmental video: http://www.thefutureschannel.com/movies/environmental_movies.php Powermills Activity Sheet: http://www.thefutureschannel.com/pdf/algebra/powermills.pdf. Unit 3 – Investigation 4 Overview CT Algebra I Model Curriculum Version 3.0
