Measurement of branching fraction for B 0 decay to η`K* 0 at Belle
advertisement
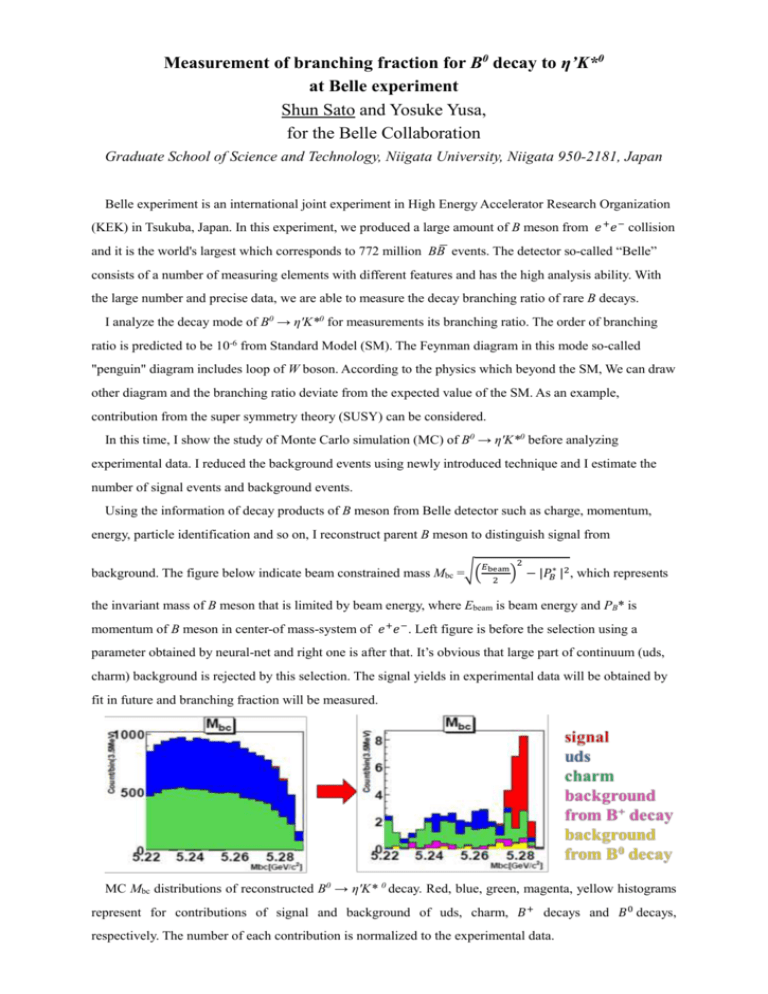
Measurement of branching fraction for B0 decay to η’K*0 at Belle experiment Shun Sato and Yosuke Yusa, for the Belle Collaboration Graduate School of Science and Technology, Niigata University, Niigata 950-2181, Japan Belle experiment is an international joint experiment in High Energy Accelerator Research Organization (KEK) in Tsukuba, Japan. In this experiment, we produced a large amount of B meson from 𝑒 + 𝑒 − collision ̅ events. The detector so-called “Belle” and it is the world's largest which corresponds to 772 million BB consists of a number of measuring elements with different features and has the high analysis ability. With the large number and precise data, we are able to measure the decay branching ratio of rare B decays. I analyze the decay mode of B0 → η'K*0 for measurements its branching ratio. The order of branching ratio is predicted to be 10-6 from Standard Model (SM). The Feynman diagram in this mode so-called "penguin" diagram includes loop of W boson. According to the physics which beyond the SM, We can draw other diagram and the branching ratio deviate from the expected value of the SM. As an example, contribution from the super symmetry theory (SUSY) can be considered. In this time, I show the study of Monte Carlo simulation (MC) of B0 → η'K*0 before analyzing experimental data. I reduced the background events using newly introduced technique and I estimate the number of signal events and background events. Using the information of decay products of B meson from Belle detector such as charge, momentum, energy, particle identification and so on, I reconstruct parent B meson to distinguish signal from 𝐸beam 2 background. The figure below indicate beam constrained mass Mbc =√( 2 ) − |𝑃𝐵∗ |2 , which represents the invariant mass of B meson that is limited by beam energy, where Ebeam is beam energy and PB* is momentum of B meson in center-of mass-system of 𝑒 + 𝑒 −. Left figure is before the selection using a parameter obtained by neural-net and right one is after that. It’s obvious that large part of continuum (uds, charm) background is rejected by this selection. The signal yields in experimental data will be obtained by fit in future and branching fraction will be measured. MC Mbc distributions of reconstructed B0 → η'K* 0 decay. Red, blue, green, magenta, yellow histograms represent for contributions of signal and background of uds, charm, 𝐵+ decays and 𝐵0 decays, respectively. The number of each contribution is normalized to the experimental data.
