Lesson 10
NYS COMMON CORE MATHEMATICS CURRICULUM
6•6
Lesson 10: Describing Distributions Using the Mean and MAD
Classwork
Example 1: Describing Distributions
In Lesson 9, Sabina developed the mean absolute deviation (MAD) as a number that measures variability in a data
distribution. Using the mean and MAD with a dot plot allows you to describe the center, spread, and shape of a data
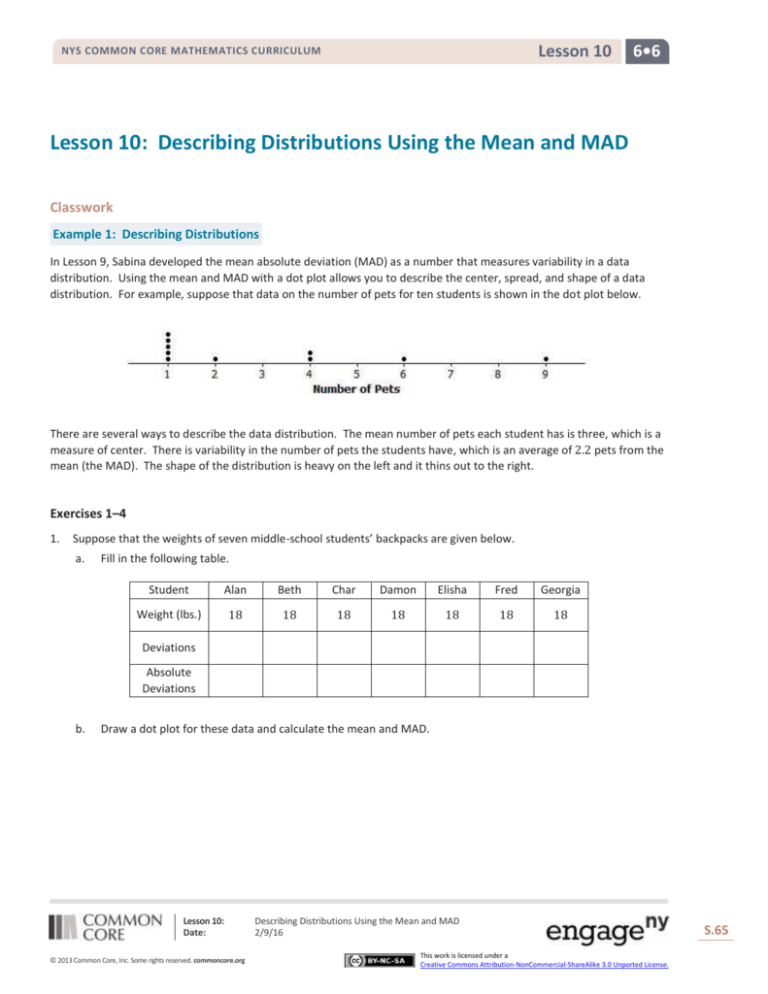
distribution. For example, suppose that data on the number of pets for ten students is shown in the dot plot below.
There are several ways to describe the data distribution. The mean number of pets each student has is three, which is a
measure of center. There is variability in the number of pets the students have, which is an average of 2.2 pets from the
mean (the MAD). The shape of the distribution is heavy on the left and it thins out to the right.
Exercises 1–4
1.
Suppose that the weights of seven middle-school students’ backpacks are given below.
a.
Fill in the following table.
Student
Alan
Beth
Char
Damon
Elisha
Fred
Georgia
Weight (lbs.)
18
18
18
18
18
18
18
Deviations
Absolute
Deviations
b.
Draw a dot plot for these data and calculate the mean and MAD.
Lesson 10:
Date:
© 2013 Common Core, Inc. Some rights reserved. commoncore.org
Describing Distributions Using the Mean and MAD
2/9/16
S.65
This work is licensed under a
Creative Commons Attribution-NonCommercial-ShareAlike 3.0 Unported License.
65
Lesson 10
NYS COMMON CORE MATHEMATICS CURRICULUM
c.
2.
3.
6•6
Describe this distribution of weights of backpacks by discussing the center, spread, and shape.
Suppose that the weight of Elisha’s backpack is 17 pounds, rather than 18.
a.
Draw a dot plot for the new distribution.
b.
Without doing any calculation, how is the mean affected by the lighter weight? Would the new mean be the
same, smaller, or larger?
c.
Without doing any calculation, how is the MAD affected by the lighter weight? Would the new MAD be the
same, smaller, or larger?
Suppose that in addition to Elisha’s backpack weight having changed from 18 to 17 lb., Fred’s backpack weight is
changed from 18 to 19 lb.
a.
Draw a dot plot for the new distribution.
Lesson 10:
Date:
© 2013 Common Core, Inc. Some rights reserved. commoncore.org
Describing Distributions Using the Mean and MAD
2/9/16
S.66
This work is licensed under a
Creative Commons Attribution-NonCommercial-ShareAlike 3.0 Unported License.
66
Lesson 10
NYS COMMON CORE MATHEMATICS CURRICULUM
4.
6•6
b.
Without doing any calculation, what would be the value of the new mean compared to the original mean?
c.
Without doing any calculation, would the MAD for the new distribution be the same, smaller, or larger than
the original MAD?
d.
Without doing any calculation, how would the MAD for the new distribution compare to the one in Exercise 2?
Suppose that seven second-graders’ backpack weights were:
Student
Weight (lbs.)
Alice
5
Bob
5
Carol
5
Damon
5
Ed
5
Felipe
5
Gale
5
a.
How is the distribution of backpack weights for the second-graders similar to the original distribution for sixthgraders given in Exercise 1?
b.
How are the distributions different?
Lesson 10:
Date:
© 2013 Common Core, Inc. Some rights reserved. commoncore.org
Describing Distributions Using the Mean and MAD
2/9/16
S.67
This work is licensed under a
Creative Commons Attribution-NonCommercial-ShareAlike 3.0 Unported License.
67
Lesson 10
NYS COMMON CORE MATHEMATICS CURRICULUM
6•6
Example 2: Using the Mean Versus the MAD
Decision-making by comparing distributions is an important function of statistics. Recall that Robert is trying to decide
whether to move to New York City or to San Francisco based on temperature. Comparing the center, spread, and shape
for the two temperature distributions could help him decide.
From the dot plots, Robert saw that monthly temperatures in New York City were spread fairly evenly from around 40
degrees to the 80s, but in San Francisco the monthly temperatures did not vary as much. He was surprised that the
mean temperature was about the same for both cities. The MAD of 14 degrees for New York City told him that, on
average, a month’s temperature was 14 degrees above or below 63 degrees. That is a lot of variability, which was
consistent with the dot plot. On the other hand, the MAD for San Francisco told him that San Francisco’s monthly
temperatures differ, on average, only 3.5 degrees from the mean of 64 degrees. So, the mean doesn’t help Robert very
much in making a decision, but the MAD and dot plot are helpful.
Which city should he choose if he loves hot weather and really dislikes cold weather?
Lesson 10:
Date:
© 2013 Common Core, Inc. Some rights reserved. commoncore.org
Describing Distributions Using the Mean and MAD
2/9/16
S.68
This work is licensed under a
Creative Commons Attribution-NonCommercial-ShareAlike 3.0 Unported License.
68
Lesson 10
NYS COMMON CORE MATHEMATICS CURRICULUM
6•6
Exercises 5–7
5.
Robert wants to compare temperatures for Cities B and C.
City B
City C
6.
J
54
54
F
54
44
M
58
54
A
63
61
M
63
63
J
68
72
J
72
78
A
72
85
S
72
78
O
63
59
N
63
54
D
54
54
a.
Draw a dot plot of the monthly temperatures for each of the cities.
b.
Verify that the mean monthly temperature for each distribution is 63 degrees.
c.
Find the MAD for each of the cities. Interpret the two MADs in words and compare their values.
How would you describe the differences in the shapes of the monthly temperature distributions of the two cities?
Lesson 10:
Date:
© 2013 Common Core, Inc. Some rights reserved. commoncore.org
Describing Distributions Using the Mean and MAD
2/9/16
S.69
This work is licensed under a
Creative Commons Attribution-NonCommercial-ShareAlike 3.0 Unported License.
69
Lesson 10
NYS COMMON CORE MATHEMATICS CURRICULUM
7.
6•6
Suppose that Robert had to decide between Cities D, E, and F.
City D
City E
City F
J
54
56
42
F
44
56
42
M
54
56
70
A
59
56
70
M
63
56
70
J
72
84
70
J
78
84
70
A
87
84
70
S
78
56
70
O
59
56
70
N
54
56
70
D
54
56
42
Mean
63
63
63
MAD
10.5
10.5
10.5
a.
Draw dot plots for each distribution.
b.
Interpret the MAD for the distributions. What does this mean about variability?
c.
How will Robert decide to which city he should move? List possible reasons Robert might have for choosing
each city.
Lesson 10:
Date:
© 2013 Common Core, Inc. Some rights reserved. commoncore.org
Describing Distributions Using the Mean and MAD
2/9/16
S.70
This work is licensed under a
Creative Commons Attribution-NonCommercial-ShareAlike 3.0 Unported License.
70
Lesson 10
NYS COMMON CORE MATHEMATICS CURRICULUM
6•6
Lesson Summary
A data distribution can be described in terms of its center, spread, and shape.
The center can be measured by the mean.
The spread can be measured by the mean absolute deviation (MAD).
A dot plot shows the shape of the distribution.
Problem Set
1.
Draw a dot plot of the times that five students studied for a test if the mean time they studied was two hours and
the MAD was zero hours.
2.
Suppose the times that five students studied for a test is as follows:
Student
Time (hrs.)
Aria
1.5
Ben
2
Chloe
2
Dellan
2.5
Emma
2
Michelle said that the MAD for this data set is 0 because the dot plot is balanced around 2. Without doing any
calculation, do you agree with Michelle? Why or why not?
3.
Suppose that the number of text messages eight students receive on a typical day is as follows:
Student
Number
1
42
2
56
3
35
4
70
5
56
6
50
7
65
8
50
a.
Draw a dot plot for the number of text messages received on a typical day by these eight students.
b.
Find the mean number of text messages these eight students receive on a typical day.
c.
Find the MAD number of text messages and explain its meaning using the words of this problem.
d.
Describe the shape of this data distribution.
e.
Suppose that in the original data set, Student 3 receives an additional five more text messages per day, and
Student 4 receives five fewer messages per day.
i.
Without doing any calculation, does the mean for the new data set stay the same, increase, or decrease
as compared to the original mean? Explain your reasoning.
ii.
Without doing any calculation, does the MAD for the new data set stay the same, increase, or decrease as
compared to the original MAD? Explain your reasoning.
Lesson 10:
Date:
© 2013 Common Core, Inc. Some rights reserved. commoncore.org
Describing Distributions Using the Mean and MAD
2/9/16
S.71
This work is licensed under a
Creative Commons Attribution-NonCommercial-ShareAlike 3.0 Unported License.
71


