1 - Energy Systems Laboratory
advertisement
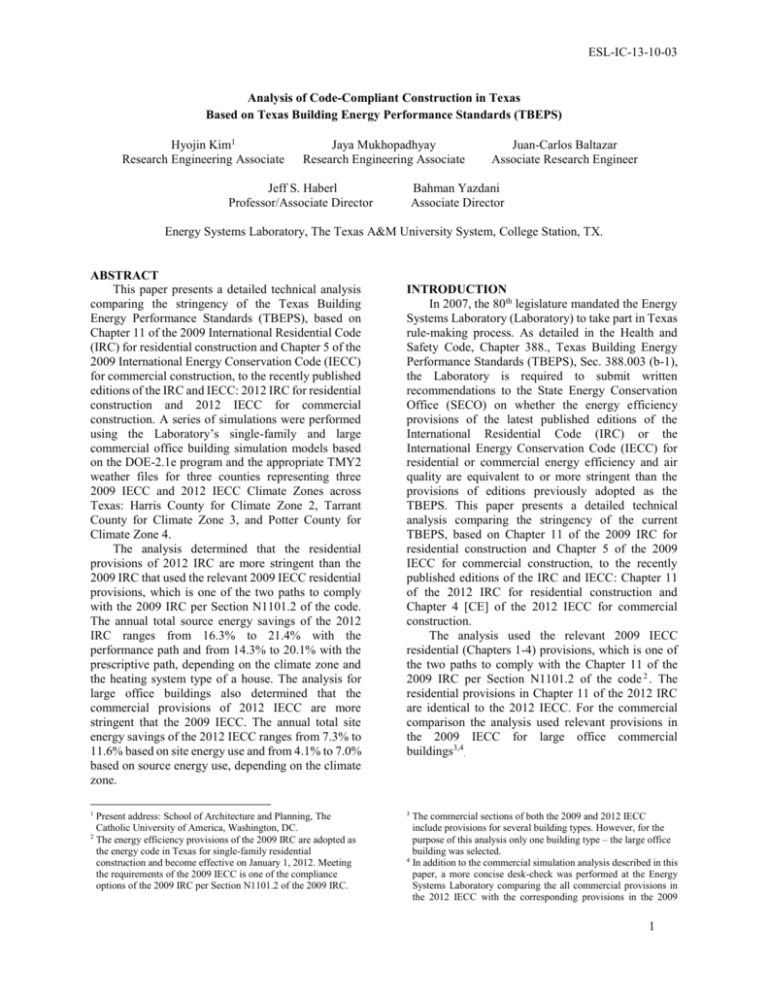
ESL-IC-13-10-03 Analysis of Code-Compliant Construction in Texas Based on Texas Building Energy Performance Standards (TBEPS) Hyojin Kim1 Research Engineering Associate Jaya Mukhopadhyay Research Engineering Associate Jeff S. Haberl Professor/Associate Director Juan-Carlos Baltazar Associate Research Engineer Bahman Yazdani Associate Director Energy Systems Laboratory, The Texas A&M University System, College Station, TX. ABSTRACT This paper presents a detailed technical analysis comparing the stringency of the Texas Building Energy Performance Standards (TBEPS), based on Chapter 11 of the 2009 International Residential Code (IRC) for residential construction and Chapter 5 of the 2009 International Energy Conservation Code (IECC) for commercial construction, to the recently published editions of the IRC and IECC: 2012 IRC for residential construction and 2012 IECC for commercial construction. A series of simulations were performed using the Laboratory’s single-family and large commercial office building simulation models based on the DOE-2.1e program and the appropriate TMY2 weather files for three counties representing three 2009 IECC and 2012 IECC Climate Zones across Texas: Harris County for Climate Zone 2, Tarrant County for Climate Zone 3, and Potter County for Climate Zone 4. The analysis determined that the residential provisions of 2012 IRC are more stringent than the 2009 IRC that used the relevant 2009 IECC residential provisions, which is one of the two paths to comply with the 2009 IRC per Section N1101.2 of the code. The annual total source energy savings of the 2012 IRC ranges from 16.3% to 21.4% with the performance path and from 14.3% to 20.1% with the prescriptive path, depending on the climate zone and the heating system type of a house. The analysis for large office buildings also determined that the commercial provisions of 2012 IECC are more stringent that the 2009 IECC. The annual total site energy savings of the 2012 IECC ranges from 7.3% to 11.6% based on site energy use and from 4.1% to 7.0% based on source energy use, depending on the climate zone. 1 Present address: School of Architecture and Planning, The Catholic University of America, Washington, DC. 2 The energy efficiency provisions of the 2009 IRC are adopted as the energy code in Texas for single-family residential construction and become effective on January 1, 2012. Meeting the requirements of the 2009 IECC is one of the compliance options of the 2009 IRC per Section N1101.2 of the 2009 IRC. INTRODUCTION1 In 2007, the 80th legislature mandated the Energy Systems Laboratory (Laboratory) to take part in Texas rule-making process. As detailed in the Health and Safety Code, Chapter 388., Texas Building Energy Performance Standards (TBEPS), Sec. 388.003 (b-1), the Laboratory is required to submit written recommendations to the State Energy Conservation Office (SECO) on whether the energy efficiency provisions of the latest published editions of the International Residential Code (IRC) or the International Energy Conservation Code (IECC) for residential or commercial energy efficiency and air quality are equivalent to or more stringent than the provisions of editions previously adopted as the TBEPS. This paper presents a detailed technical analysis comparing the stringency of the current TBEPS, based on Chapter 11 of the 2009 IRC for residential construction and Chapter 5 of the 2009 IECC for commercial construction, to the recently published editions of the IRC and IECC: Chapter 11 of the 2012 IRC for residential construction and Chapter 4 [CE] of the 2012 IECC for commercial construction. The analysis used the relevant 2009 IECC residential (Chapters 1-4) provisions, which is one of the two paths to comply with the Chapter 11 of the 2009 IRC per Section N1101.2 of the code 2 . The residential provisions in Chapter 11 of the 2012 IRC are identical to the 2012 IECC. For the commercial comparison the analysis used relevant provisions in the 2009 IECC for large office commercial buildings3,4. 3 The commercial sections of both the 2009 and 2012 IECC include provisions for several building types. However, for the purpose of this analysis only one building type – the large office building was selected. 4 In addition to the commercial simulation analysis described in this paper, a more concise desk-check was performed at the Energy Systems Laboratory comparing the all commercial provisions in the 2012 IECC with the corresponding provisions in the 2009 1 ESL-IC-13-10-03 METHODOLOGY The analysis was performed using the Laboratory’s code-compliant single-family simulation5 that includes new EIR calculation models6 and large commercial office building simulation models based on the DOE-2.1e program and the appropriate TMY2 weather files. Three counties in Texas representing three 2009 IECC and 2012 IECC Climate Zones across Texas were selected: Harris County for Climate Zone 2, Tarrant County for Climate Zone 3, and Potter County for Climate Zone 4 (Figure 1). Residential Single-Family Analysis The base-case building is a 2,325 sq. ft., squareshape, one story, single-family, detached house with a floor-to-ceiling height of 8 feet. The house has an attic with a roof pitched at 23 degrees. The wall construction is light-weight wood frame with 2x4 studs at 16” on center with a slab-on-grade-floor, which is typical construction according to the National Association of Home Builders - survey (NAHB 2003). The mechanical systems were assumed to be in the unconditioned, vented attic, and the house was assumed to be equipped with mechanical ventilation system7. Since the mechanical ventilation includes the exhaust fans in bathroom and kitchen, this study determined that it would be more reasonable to simulate mechanical ventilation for both 2009 IECC and 2012 IRC/2012 IECC code-compliant houses. This assumption on the mechanical ventilation also agrees with the study by Lucas et al. (2012). Two options were considered for heating fuel type: (a) an electric/gas house (gas-fired furnace for space heating, and gas water heater for domestic water heating) and for (b) an all-electric house (heat pump for space heating, and electric water heater for domestic water heating). Table 1 summarizes the base-case building characteristics used in the residential simulation IECC specifically for the State of Texas. This study concluded that for most sections the 2012 IECC is more stringent than the 2009 IECC. Details of this desk-check can be found in Mukhopadhyay et al. (2011b). 5 The single-family analysis was performed using the International Code Compliance Calculator (IC3) developed by the Laboratory. IC3 is Residential Energy Services Network (RESNET)accredited web-based, code-compliance software to demonstrate the performance of proposed single family residences according to the TBEPS. 6 Details on a new cooling EIR calculation model are available in Kim et al (2013). 7 A mechanical ventilation system is required to be installed for the houses that have an air infiltration rate less than 5 ACH50 per Section R403.5 of 2012 IECC and Section R 303.4 of 2012 IRC. Since the 2012 IECC requires the tested air leakage rate of not exceeding 5 ACH50 in Climate Zones 1 and 2, and 3 ACH50 in Climate Zones 3 through 8 to comply with the 2012 IECC, the Figure 1. 2009 IECC/2012 IECC Climate Zone Classification and Three Selected Counties in Texas model for a performance path analysis and a prescriptive path analysis 8 : 2009 IECC versus 2012 IRC/2012 IECC. To facilitate a better comparison between the two codes, both interior shading fractions specified in the 2009 IECC performance path were adjusted to match the values provided in the 2012 IRC/2012 IECC: 0.87 for Climate Zones 2 and 3 and 0.84 for Climate Zone 4. In addition, a second set of simulations for the 2012 IRC/2012 IECC performance path were created and labeled ‘2012 IRC and 2012 IECC Performance Modified’ in the table. In this modification, internal heat gains of the 2012 IRC and 2012 IECC performance path were adjusted to include 75% of high-efficacy lamps for 2012 IRC/2012 IECC9. Several changes were made in the 2012 IRC and 2012 IECC performance path analysis. Specifically, the building envelope and systems components that have different specifications from the 2009 IECC performance path are highlighted in light orange in houses need to be provided with appropriate ventilation rate based on the Table M1507.3.3(1) of the 2012 IRC. Unlike the performance path, the prescriptive path analysis does not provide specifications for a number of components that are needed for simulations. Hence, this analysis assumed that the components that are not specified in the prescriptive path provision are same as performance path specifications. 9 The provision of high-efficacy lamps becomes mandatory per Sec. R404.1 of the 2012 IECC, which requires a minimum of 75 percent of the lamps to be high-efficacy lamps. To take account of this provision, a modification was applied to the 2012 IECC Performance Path. In this modification, the internal heat gains of a house without high-efficacy lamps was assumed to be 1.095 kW (i.e., 0.547 kW for lighting and 0.547 kW for equipment) per Table 405.5.2(1) of 2009 IECC and Table R405.5.2(1) of 2012 IECC. Then the reduced internal heat gains by replacing the 75 percent of the existing lighting fixtures with high-efficacy lamps were calculated as 0.239 kW by assuming that the high-efficacy lamp uses 75 percent less energy than the existing lamp. 8 2 ESL-IC-13-10-03 Table 1. Base Case Building Description for Residential Single-Family Analysis Building Component Performance Path Analysis Prescriptive Path Analysis 2012 IRC/ 2012 IRC/ 2012 IRC/ 2009 IECC 2012 IECC 2012 IECC Modified 2012 IECC CZ 2 CZ 3 CZ 4 CZ 2 CZ 3 CZ 4 CZ 2 CZ 3 CZ 4 CZ 2 CZ 3 CZ 4 CZ 2 CZ 3 CZ 4 2009 IECC Envelope Exterior Walls Roof Floor / Slab Windows Shading Air Exchange Rate2 Type U-Factor 0.082 Absorptance Type U-Factor 0.035 0.030 Absorptance Radiant Barrier Type R-Value None R-10 WWR % U-Factor 0.65 0.50 0.35 SHGC 0.30 0.40 Interior1 0.87 0.84 Exterior Air Leakage 0.00036 SLA Mech. Ventilation Space Conditions Temperature Set point Light Heat Gains Equipment Heat Gains Mechanical Systems Type/Capacity Air Conditioner Efficiency Electric/Gas Type/Capacity House Efficiency All-Electric Type/Capacity House Efficiency Leakage3 Duct Distribution Insulation DHW DHW Daily Consumption 0.547 kW 11.2%4 R-6/R-6 Light-weight wood frame with 2x4 studs spaced at 16” on center 0.082 0.057 0.082 0.057 0.082 0.082 0.057 0.75 Light-weight wood frame, Unconditioned, vented attic 0.030 0.026 0.030 0.026 0.035 0.030 0.030 0.026 0.75 No Slab-on-grade floor None R-10 None R-10 None R-10 None R-10 15% of conditioned floor area 0.40 0.35 0.35 0.40 0.35 0.35 0.65 0.50 0.35 0.40 0.35 0.35 0.25 0.40 0.25 0.40 0.30 0.40 0.25 0.40 0.87 0.84 0.87 0.84 0.87 0.84 0.87 0.84 None 5 ACH50 3 ACH50 5 ACH50 3 ACH50 5 ACH50 3 ACH50 (0.00025 (0.00015 (0.00025 (0.00015 (0.00025 (0.00015 7 ACH50 SLA) SLA) SLA) SLA) SLA) SLA) (0.00036 SLA) 60.8 CFM (0.20 ACH) 60.8 CFM (0.20 ACH) 60.8 CFM (0.20 ACH) 0.547 kW 72°F Heating, 75°F Cooling 0.239 kW with 75% 0.342 kW with 50% high-efficacy lamps high-efficacy lamps 0.547 kW 55,800 (= 500 ft2/ton) 13 SEER Gas-fired furnace, 55,800 (= 1.0 x cooling capacity) 0.78 AFUE Heat pump heating, 55,800 (= 1.0 x cooling capacity) 7.7 HSPF 4.2%5 4.2%5 11.2%4 R-6/R-6 R-6/R-6 R-8/R-6 0.239 kW with 75% high-efficacy lamps 4.2%5 R-8/R-6 70 gal/day (a) Electric/Gas House (40-gallon tank type gas water heater): 0.594 Type/Energy Factor (b) All-Electric House (50-gallon tank type electric water heater): 0.904 Notes: The cells highlighted in orange represent the 2012 IRC/2012 IECC specifications that are different from the 2009 IECC. 1) To facilitate a more accurate and realistic comparison between the codes, an adjustment was applied to the interior shading values of 2009 IECC codes: 0.7 for summer and 0.85 for winter. 2) Air exchange rate = air leakage rate in addition to the mechanical ventilation rate per 2012 IECC Table R405.5.2 (1). 3) The mechanical systems of the houses were assumed to be located in the unconditioned, vented attic, which requires a duct leakage test in both 2009 IECC and 2012 IECC. 4) Calculated from a maximum duct leakage to outdoors as specified in 2009 IECC Sec. 403.2.2: 8 CFM per 100 sq.ft. of CFA . 5) Calculated from a maximum total duct leakage as specified in 2012 IECC Sec. R403.2.2: 4 CFM per 100 sq.ft. of CFA with an assumed fraction of duct areas outside the conditioned space = 0.75 . the table 10 . The changes considered in this analysis include: 1) Increased wall insulation (CZ 3 and 4). 2) Increased roof insulation. 3) Decreased glazing U-factor (CZ 2 and 3). 10 Hot water pipe R-3 insulation provision in Sec R403.4.2 of the 2012 IECC was not evaluated in this analysis. In order to meet the 2012 IECC, the house was assumed to be equipped with a mechanical ventilation system. The performance path analysis of the 2012 IECC requires that the mechanical ventilation rate shall be in addition to the air leakage rate to 11 4) Decreased glazing SHGC (CZ 2 and 3). 5) Reduced air leakage rate. 6) Increased air exchange rate due to added mechanical ventilation rate11. determine an air exchange rate of a house while the 2009 IECC performance path does not have any specifications regarding the mechanical ventilation rate for its standard reference house. Thus, for an air exchange rate of a house, a value of 0.00036 SLA was used for 2009 IECC performance path, while for 2012 IRC/2012 IECC, an air exchange rate was simulated with an air leakage of 5 3 ESL-IC-13-10-03 7) 75% of high-efficacy lamps for Performance Modified and Prescriptive Path. 8) Reduced duct leakage. Commercial Large Office Analysis The base-case building is a six-story office building as described in studies by Ahmad et al., (2005), Kim et al., (2009) and Mukhopadhyay et al., (2011a). The aspect ratio was kept at 1.5:1 (Leach et al., 2010). The resulting building dimensions are 149.42 ft. x 99.62 ft, which translates to a footprint area of 14,885 ft2 and a total conditioned floor area of 89,311 ft2. The floor-to-floor height is set at 13 ft. A plenum is modeled for each floor. The height of the plenum is set at 4 ft. Each floor of the building is divided into four perimeter zones and a central core zone. The perimeter zones face the four orientations and have a width of 15 ft. Table 2 summarizes the base-case building characteristics used in the commercial simulation model for a performance path analysis: 2009 IECC versus 2012 IECC. Details are provided for the building envelope, lighting, HVAC systems and service water heating systems implemented in the simulation model. Several changes were made in the 2012 IECC performance path analysis for commercial buildings. The building envelope and systems components that have different specifications from the 2009 IECC Table 2. Base Case Building Description for Commercial Large Office Analysis Building Component CZ 2 2009 IECC CZ 3 CZ 4 CZ 2 2012 IECC CZ 3 CZ 4 Envelope Exterior Walls Roof Floor / Slab Windows Doors Infiltration Type R-value (h·ft²·°F/Btu) Absorptance Type R-value (h·ft²·°F/Btu) Absorptance Emittance Type R-13 R-value (h·ft²·°F/Btu) WWR % Framing Type U-factor (Btu/h·ft²·°F) SHGC Overhang Door Type U-factor (Btu/h·ft²·°F) Provision of Air Barrier Rate (ACH) Steel frame with 6” metal studs spaced at 16” on center R-13+3.8 c.i. R-13+7.5 c.i. R-13+5.0 c.i. R-13+7.5 c.i. 0.75 Insulation Entirely Above Deck R-20 c.i. R-20 c.i. 0.75 0.9 Slab-on-Grade, Unheated None R-13+7.5 c.i. R-25 c.i. R-10 for 2' below None 40% Metal framing U-0.75 U-0.65 0.25 U-0.55 0.40 Fixed U-0.46 U-0.50 0.25 U-0.38 0.40 None Swinging 0.7 None Core: 0.043, Perimeter: 0.070 0.61 None Core: 0.043, Perimeter: 0.070 Mandatory Core:0.010, Perimeter: 0.015 Space Conditions Temperature Set point1 70°F Heating, 75°F Cooling with -10°F Setback and +5°F Setup Lighting Power Density (W/ft2) 1.0 W/ft2 0.9 W/ft2 Equipment Heat Gains (Plug Loads) 0.75 W/ft2 Mechanical Systems (VAV w/ reheat) Type/Capacity2 Screw chiller, ≥ 150 tons and < 300 tons Chiller Efficiency3 5.17 COP Type/Capacity2 Two gas-fired hot water boilers, ≥ 300 kBtu/hr and ≤ 2,500 kBtu/hr Boiler Efficiency 75% Et 80% Et Mechanical Ventilation 0.08 cfm/ft2 (5 cfm/person and 0.06 cfm/ft2) Supply Air 1.10 cfm/ft2 Economizer None None (Trade-Off)4 SWH SHW peak consumption 74 gal/hr Type/Capacity Gas storage water heater (106-gallon tank type, 100,000 Btu/hr) Efficiency 80% Et (SL=1258 Btu/h) Notes: The cells highlighted in orange represent the 2012 IECC specifications that are different from the 2009 IECC. 1) The heating and cooling set point schedule is from Thornton et al. (2011). ACH50 for Climate Zone 2 and 3 ACH50 for Climate Zone 3 and 4 in addition to the mechanical ventilation of 61 CFM (0.20 ACH). 4 ESL-IC-13-10-03 2) Sizing runs performed using the 99.6% (winter) and 1% (summer) design temperature values from Chapter 14 of the 2009 ASHRAE Handbook-Fundamentals (ASHRAE 2009). 3) In this analysis, compliance of chiller performance requirements was demonstrated by meeting the minimum requirements of Path A for both full load in both 2009 IECC and 2012 IECC. Modeling of IPLV was not considered by this analysis. 4) The simulation model used for this analysis takes advantage of the trade-off option specified in Table C403.3.1(2) of 2012 IECC, by increasing cooling efficiency instead of modeling economizers for climate zone 2 and 3. performance path are highlighted in light orange in the table. The changes considered in this analysis include: 1) Increased wall insulation (CZ 2 and 3) 2) Increased roof insulation (CZ 4). 3) Added slab insulation (CZ 4). 4) Decreased glazing U-factor. 5) Decreased door U-factor. 6) Reduced air leakage rate due to an installation of air-barriers12 (CZ 4). 7) Decreased lighting power density. 8) Increased boiler efficiency. RESULTS FOR RESIDENTIAL ANALYSIS Figures 2 and 3 present the detailed simulation results of electric/gas and all-electric houses in three selected counties in Texas for a performance path analysis and a prescriptive path analysis, respectively. Table 3 presents the total annual source energy savings of the 2012 IRC/2012 IECC compared to the 2009 IECC for electric/gas and all-electric houses in three selected counties in Texas for both comparisons of performance path and prescriptive path analysis. Performance Path Analysis Across all counties, both the 2012 IRC/2012 IECC and the modified 2012 IRC/2012 IECC performance path code-compliant house reported less site energy consumption than the 2009 IECC. The total annual site energy consumption of a 2009 IECC performance path code-compliant house are: (a) electric/gas house: 99.4 MMBtu/yr (42.8 kBtu/ft2∙yr) for Harris County, 108.6 MMBtu/yr (46.7 kBtu/ft2∙yr) for Tarrant County, and 137.7 MMBtu/yr (59.2 kBtu/ft2∙yr) for Potter County; and (b) all-electric house: 76.2 MMBtu/yr (32.8 kBtu/ft2∙yr) for Harris County, 77.9 MMBtu/yr (37.9 kBtu/ft2∙yr) for Tarrant County, and 88.2 MMBtu/yr (37.9 kBtu/ft2∙yr) for Potter County. The modified 2012 IRC/2012 IECC performance path code-compliant house reported the following site energy totals: (a) electric/gas house: 84.6 MMBtu/yr (36.4 kBtu/ft2∙yr) for Harris County, 93.2 MMBtu/yr (40.1 kBtu/ft2∙yr) for Tarrant County, and 118.4 MMBtu/yr (50.9 kBtu/ft2∙yr) for Potter 12 The use of air-barriers is introduced as a mandatory requirement in the 2012 IECC for climate zone 4, which reduces the infiltration values for opaque building components to 0.04 cfm/sq.ft. The values reported in the code are at a pressure difference of 0.3 in. w.c. which is different that the pressure difference of 0.017 in. w.c. required of the values input to the DOE-2.1e. Thus in the simulations without air barriers, this County; and (b) all-electric house: 62.2 MMBtu/yr (26.8 kBtu/ft2∙yr) for Harris County, 61.6 MMBtu/yr (26.5 kBtu/ft2∙yr) for Tarrant County, and 73.8 MMBtu/yr (31.7 kBtu/ft2∙yr) for Potter County. The annual source energy savings associated with the modified 2012 IRC/2012 IECC performance path were then calculated by comparisons to the respective, 2009 IECC performance path code-compliant houses. To calculate source energy consumption, the multipliers of 3.16 for electricity and 1.1 for natural gas were applied to site energy use per Section 405.3 of the 2009 IECC and Section R405.3 of the 2012 IECC. Across all counties, both the 2012 IRC/2012 IECC and the modified 2012 IRC/2012 IECC performance path code-compliant house reported less source energy consumption than the 2009 IECC. The annual source energy savings associated with the modified 2012 IRC/2012 IECC performance path are: (a) electric/gas house: 44.3 MMBtu/yr (19.1 kBtu/ft2∙yr) for Harris County, 50.5 MMBtu/yr (21.7 kBtu/ft2∙yr) for Tarrant County, and 46.2 MMBtu/yr (19.9 kBtu/ft2∙yr) for Potter County; and (b) all-electric house: 44.2 MMBtu/yr (19.0 kBtu/ft2∙yr) for Harris County, 51.5 MMBtu/yr (22.2 kBtu/ft2∙yr) for Tarrant County, and 45.5 MMBtu/yr (19.6 kBtu/ft2∙yr) for Potter County. This corresponds to: (a) electric/gas house: 19.4% for Harris County, 21.4% for Tarrant County, and 18.3% for Potter County; and (b) all-electric house: 18.4% for Harris County, 20.9% for Tarrant County, and 16.3% for Potter County. The lighting provision (i.e., 75% high efficacy lamps) was found to be the single greatest factor that contributed to the large savings with the modified 2012 IRC/2012 IECC. Prescriptive Path Analysis Across all counties, both the 2012 IRC/2012 IECC and the modified 2012 IRC/2012 IECC performance path code-compliant house reported less site energy consumption than the 2009 IECC. The total annual site energy consumption of a 2009 IECC prescriptive path code-compliant house are: (a) electric/gas house: 102.1 MMBtu/yr (43.9 kBtu/ft2∙yr) analysis used the infiltration values provided by Leach et. al., (2010), which is typical infiltration values for a large office building at a pressure difference of 0.017 in. w.c. For the simulations with air barriers, this analysis also used the infiltration values provided by Leach et al., which are reduced values as a result of installation of air-barriers. 5 ESL-IC-13-10-03 for Harris County, 114.2 MMBtu/yr (49.1 kBtu/ft2∙yr) for Tarrant County, and 149.0 MMBtu/yr (64.1 kBtu/ft2∙yr) for Potter County; and (b) all-electric house: 72.1 MMBtu/yr (31.0 kBtu/ft2∙yr) for Harris County, 74.4 MMBtu/yr (32.0 kBtu/ft2∙yr) for Tarrant County, and 87.0 MMBtu/yr (37.4 kBtu/ft2∙yr) for Potter County. The modified 2012 IRC/2012 IECC prescriptive path code-compliant house reported the following site energy totals: (a) electric/gas house: 83.6 MMBtu/yr (36.0 kBtu/ft2∙yr) for Harris County, 91.9 MMBtu/yr (39.5 kBtu/ft2∙yr) for Tarrant County, and 115.9 MMBtu/yr (49.8 kBtu/ft2∙yr) for Potter County; and (b) all-electric house: 61.8 MMBtu/yr (26.6 kBtu/ft2∙yr) for Harris County, 61.1 MMBtu/yr (26.3 kBtu/ft2∙yr) for Tarrant County, and 73.0 MMBtu/yr (31.4 kBtu/ft2∙yr) for Potter County. The annual source energy savings associated with the modified 2012 IRC/2012 IECC prescriptive path were then calculated by comparisons to the respective, 2009 IECC prescriptive path code-compliant houses. Across all counties, both the 2012 IRC/2012 IECC and the modified 2012 IRC/2012 IECC prescriptive path code-compliant house reported less source energy consumption than the 2009 IECC. The annual source energy savings associated with the modified 2012 IRC/2012 IECC prescriptive path are: (a) electric/gas house: 36.6 MMBtu/yr (15.7 kBtu/ft2∙yr) for Harris County, 46.2 MMBtu/yr (19.9 kBtu/ft2∙yr) for Tarrant County, and 48.8 MMBtu/yr (21.0 kBtu/ft2∙yr) for Potter County; and (b) all-electric/gas house: 32.5 MMBtu/yr (14.0 kBtu/ft2∙yr) for Harris County, 42.0 MMBtu/yr (18.1 kBtu/ft2∙yr) for Tarrant County, and 44.2 MMBtu/yr (19.0 kBtu/ft2∙yr) for Potter County. This corresponds to: (a) electric/gas house: 16.7% for Harris County, 20.1% for Tarrant County, and 19.3% for Potter County; and (b) all-electric/gas house: 14.3% for Harris County, 17.9% for Tarrant County, and 16.1% for Potter County. Comparison with Other Studies Several other studies have examined the economic impacts of the 2012 IECC compared to the 2009 IECC for new residential buildings in Texas, including the DOE analysis performed by Pacific Northwest National Laboratory (PNNL) (DOE 2012); and the analysis by Building Codes Assistance Project (BCAP) (2012a-2012c). The annual energy cost savings reported in these analyses are from $207 (16%) to $379 (28%) in the DOE analysis and from $248 (13%) to $277 (14%) in the BCAP analysis across the three climate zones in Texas, which (a) Electric/Gas House 6 ESL-IC-13-10-03 (b) All-Electric House Figure 2. Annual Site Energy Consumption by Different End Uses for Residential Performance Path Simulations (a) Electric/Gas House (b) All-Electric House Figure 3. Annual Site Energy Consumption by Different End Uses for Residential Prescriptive Path Simulations Table 3. Total Annual Source Energy Savings (%) of the 2012 IRC/2012 IECC Compared to the 2009 IECC: Residential Single-Family Analysis Performance Path Comparison Prescriptive Path Comparison County 2012 IRC/2012 IECC Climate Zones Electric/Gas House All-Electric House Electric/Gas House All-Electric House Harris 2 19.4% 18.4% 16.7% 14.3% 7 ESL-IC-13-10-03 Tarrant 3 21.4% 20.9% 20.1% 17.9% Potter 4 18.3% 16.3% 19.3% 16.1% generally agrees with the source energy savings reported in this study: 14% to 21%. RESULTS FOR COMMERCIAL ANALYSIS Figure 4 presents the detailed simulation results of large office buildings in three selected counties in Texas for a commercial performance path analysis. Table 4 presents the total annual site and source energy savings of the 2012 IECC compared to the 2009 IECC for a commercial performance path comparison. Performance Path Analysis Across all counties, the 2012 IECC performance path code-compliant large office building reported less site energy consumption than the 2009 IECC. The total annual site energy consumption of a 2009 IECC performance path code-compliant building are: 4,120 MMBtu/yr (46.1 kBtu/ft2∙yr) for Harris County, 4,122 MMBtu/yr (46.2 kBtu/ft2∙yr) for Tarrant County, and 4,523 MMBtu/yr (50.6 kBtu/ft2∙yr) for Potter County. The 2012 IECC performance path code-compliant building reported the following site energy totals: 3,696 MMBtu/yr (41.4 kBtu/ft2∙yr) for Harris County, 3,823 MMBtu/yr (42.8 kBtu/ft2∙yr) Figure 4. Annual Site Energy Consumption by Different End Uses for Commercial Performance Path Simulations Table 4. Total Annual Source Energy Savings (%) of the 2012 IECC Compared to the 2009 IECC: Commercial Large Office Analysis County 2012 IRC/2012 IECC Climate Zones Performance Path Comparison Site Source Harris 2 10.3% 7.0% Tarrant 3 7.3% 4.1% Potter 4 11.6% 6.2% for Tarrant County, and 3,998 MMBtu/yr (44.8 kBtu/ft2∙yr) for Potter County. The annual source energy savings associated with the 2012 IECC performance path were then calculated by comparisons to the respective, 2009 IECC performance path code-compliant buildings. Across all counties, the 2012 IECC performance path codecompliant building reported less source energy consumption than the 2009 IECC. The annual source energy savings associated with the 2012 IECC performance path are: 811 MMBtu/yr (9.1 kBtu/ft2∙yr) for Harris County, 482 MMBtu/yr (5.4 kBtu/ft2∙yr) for Tarrant County, and 745 MMBtu/yr (8.3 kBtu/ft2∙yr) for Potter County. This corresponds to: 7.0% for Harris County, 4.1% for Tarrant County, and 6.2% for Potter County. 8 ESL-IC-13-10-03 Comparison with Other Studies Several other studies examined the commercial provisions of the 2012 IECC compared to the 2009 IECC, including the two analyses performed by PNNL (Halverson et al. 2011, Mapes and Conover 2012); and the analysis performed by Niles Bolton Associates, Inc. (2012). One of the three studies quantified savings from the ASHRAE Standard 90.1-2010 prescriptive path 13 using 16 different building prototypes across the 15 climates zones in the U.S. (Halverson et al. (2011)).14 This study concluded that the energy use for each of the 16 building prototypes implementing the ASHRAE Standard 90.1-2010 prescriptive requirements was less than when implementing the ASHRAE Standard 90.1-2007 prescriptive requirements. When considering the national average energy savings 15 , the results provided 18.5% site energy savings and 18.2% source energy savings on implementing the ASHRAE Standard 90.1-2010. Specifically for large office buildings, when considering a weighted average of energy consumption across the 15 climate zones, the results provided 22.3% site energy savings and 21.5% source energy savings on implementing the ASHRAE Standard 90.1-2010. The difference in the results reported by the PNNL study and this study can be attributed to the differences in assumptions used in the simulation models of the large office building and the specifications adopted from the standards 16 , and because the results from the PNNL report energy consumption as a weighted average across the 15 climate zones. SUMMARY This paper presents a detailed technical analysis comparing the stringency of the Texas Building Energy Performance Standards (TBEPS), based on Chapter 11 of the 2009 International Residential Code (IRC) for residential construction and Chapter 5 of the 2009 International Energy Conservation Code (IECC) for commercial construction, to the recently published editions of the IRC and IECC: 2012 IRC for residential 13 To provide compliance for commercial buildings, the 2012 IECC references the ASHRAE Standard 90.1-2010 (Section C401.2, 2012 IECC), and the 2009 IECC references the ASHRAE Standard 90.1-2007 (Section 501.1, 2009 IECC). 14 Mapes annd Conover (2012) provides a complete list of revisions, additions and deletions that were made to the 2009 IECC, which formed the basis of the 2012 IECC. The report also provides an objective summary of the key changes that have been made to the IECC code on going from the 2009 version to the 2012 version. The study by Niles Bolton Associates, Inc. (2012) provides a comparison of the 2009 IECC against the 2012 IECC for low-rise and high-rise multifamily buildings, which includes a discussion on the code changes and a comparison of the implementation costs. The report noted considerable differences in the compliance costs on implementing the two codes. construction and 2012 IECC for commercial construction. A series of simulations were performed using the Laboratory’s single-family and large commercial office building simulation models based on the DOE-2.1e program and the appropriate TMY2 weather files for three counties representing three 2009 IECC and 2012 IECC Climate Zones across Texas: Harris County for Climate Zone 2, Tarrant County for Climate Zone 3, and Potter County for Climate Zone 4. The analysis determined that the residential provisions of 2012 IRC17 are more stringent than the 2009 IRC that used the relevant 2009 IECC residential provisions, which is one of the two paths to comply with the 2009 IRC per Section N1101.2 of the code. The annual total source energy savings of the 2012 IRC ranges from 16.3% to 21.4% with the performance path and from 14.3% to 20.1% with the prescriptive path, depending on the climate zone and the heating system type of a house. The analysis for large office buildings also determined that the commercial provisions of 2012 IECC are more stringent that the 2009 IECC. The annual total site energy savings of the 2012 IECC ranges from 7.3% to 11.6% based on site energy use and from 4.1% to 7.0% based on source energy use, depending on the climate zone. ACKNOWLEDGEMENT Funding for this study was provided by the Texas State Legislature through the Texas Emissions Reduction Program (TERP). REFERENCES Ahmad, M., Gilman, D., Kim, S., Chongcharoensuk, C., Malhotra, M., Haberl, J., Culp, C. 2005. Development of a Web-based Emissions Reduction Calculator for Code-compliant Commercial Construction. Proceedings of the International Conference for Enhanced Building Operations. Pittsburgh, Pennsylvania. ASHRAE. 1993. ANSI/ASHRAE Standard 136-1993 (RA 2006) - A Method of Determining Air Although neither study directly comment on the stringency of the 2012 IECC, it is implied with the use of improved building materials, practices and increased construction costs. 15 The results were reported using floor space-weighted national energy use intensity (EUI) statistics by fuel type for each building type and standard level. In order to obtain national average estimates the results were weighted by building type and climate zone. 16 The PNNL study implements prescriptive requirements. On the other hand this study implements the performance path requirements outlined in in the two standards (Chapter 11: Energy Cost Budget Method). 17 The residential provisions in Chapter 11 of the 2012 IRC are identical to the 2012 IECC. 9 ESL-IC-13-10-03 Change Rates in Detached Dwellings. Atlanta, GA: American Society of Heating, Refrigerating, and Air-Conditioning Engineers, Inc. ASHRAE. 2001. ANSI/ASHRAE Standard 62-2001 Ventilation for Acceptable Indoor Air Quality. Atlanta, GA: American Society of Heating, Refrigerating, and Air-Conditioning Engineers, Inc. ASHRAE. 2003. ASHRAE Handbook - HVAC Applications. Atlanta, GA: American Society of Heating, Refrigerating, and Air-Conditioning Engineers, Inc. ASHRAE. 2009. ASHRAE Handbook Fundamentals. Atlanta, GA: American Society of Heating, Refrigerating, and Air-Conditioning Engineers, Inc. BCAP 2012a. Analysis of Energy Savings and Incremental Construction Costs for New Single Family Homes in Houston, TX under the 2012 IECC. Washington, DC: Building Codes Assistance Project. BCAP 2012b. Dallas Residents Buying 2012 IECC Homes Will Save Thousands: An Analysis of Homeowner Profit after Paying Incremental Construction Costs for New Single Family Homes Meeting the Building Energy Code. Washington, DC: Building Codes Assistance Project. BCAP 2012c. San Antonio Residents Buying 2012 IECC Homes Will Save Thousands: An Analysis of Homeowner Profit after Paying Incremental Construction Costs for New Single Family Homes Meeting the Building Energy Code. Washington, DC: Building Codes Assistance Project. DOE 2012. Texas Energy and Cost Savings for New Single- and Multifamily Homes: 2012 IECC as Compared to the 2009 IECC. PNNL-21343. Washington, DC: United States Department of Energy. Halverson, M., M. Rosenberg, and B. Liu. 2011. ANSI/ASHRAE/IES Standard 90.1-2010 Final Determination Quantitative Analysis. PNNL20882. Richland, WA: Pacific Northwest National Laboratory. Hirsch, J. J. 2010. eQUEST, Quick Energy Simulation Tool: Introductory Tutorial. Camarillo, CA: James J. Hirsch and Associates. ICC. 2009a. 2009 International Energy Conservation Code. Country Club Hills, IL: International Code Council, Inc. ICC. 2009b. 2009 International Residential Code for One-and Two-Family Dwellings. Country Club Hills, IL: International Code Council, Inc. ICC. 2012a. 2012 International Energy Conservation Code. Country Club Hills, IL: International Code Council, Inc. ICC. 2012b. 2012 International Residential Code for One- and Two- Family Dwellings. Country Club Hills, IL: International Code Council, Inc. Kim, H., J.C. Baltazar, and J.S. Haberl. 2013. Methodology for calculating cooling and heating energy-input-ratio (EIR) from the rated seasonal performance efficiency (SEER or HSPF) (DRAFT). ESL-TR-13-04-01. College Station, TX: Energy Systems Laboratory, Texas A&M University System. Kim, S.,Haberl, J., Liu, Z. 2009. Development of DOE-2-Based Simulation Models for the CodeCompliant Commercial Construction Based on the ASHRAE Standard 90.1. Proceedings of the Ninth International Conference for Enhanced Building Operations, Austin, Texas. LBL. 1993. DOE-2 BDL Summary Version 2.1E. LBL Report No. 349346. Berkley, CA: Lawrence Berkeley Laboratory. Leach, M., Lobato, M., Hirsch, M., Pless, S., Torcellini, P. 2010. Technical Support Document for 50% Energy Savings in Large Office Buildings. Technical Report NREL/TP–55049213. Golden, Colorado: National Renewable Energy Laboratory. Lucas R.G., Z.T. Taylor, V.V. Mendon, and S. Goel. 2012. Texas energy and cost savings for new single- and multifamily homes: 2012 IECC as compared to the 2009 IECC. PNNL-21343. Richland, WA: Pacific Northwest National Laboratory. Mapes, T.S. and D.R. Conover. 2012. Guide to the Changes between the 2009 and 2012 International Energy Conservation Code. PNNL-21435. Richland, WA: Pacific Northwest National Laboratory. Mukhopadhyay, J., J.C. Baltazar, H. Kim and J. Haberl. 2011a. Comparison of ASHRAE Standard 90.1 189.1 and IECC codes for Large Office Buildings in Texas. ESL-TR-11-08-02. College Station, Texas: Energy Systems Laboratory, The Texas A&M University System. Mukhopadhyay J., J.C Baltazar, J. Haberl, B. Yazdani and S. Ellis. 2011b. A Comparison of Building Energy Code Stringency: 2009 IECC Versus 2012 IECC for Commercial Buildings. ESL-TR-11-12-07. College Station, Texas: 10 ESL-IC-13-10-03 Energy Systems Laboratory, The Texas A&M University System. NAECA. 2006. National Appliance Energy Conservation Act. NAHB. 2003. The Builders Practices Survey Reports. National Association of Home Builders. Upper Marlboro, MD: NAHB Research Center. Niles Bolton Associates, Inc. 2012. Impact of 2009 and 2012 International Energy Conservation Code in Multifamily Buildings. Niles Bolton Associates, Inc., Atlanta, Georgia. NREL. 2001. Building America House Performance Analysis Procedures. (NREL/TP-550-27754) Golden, CO: National Renewable Energy Laboratory. p.34 Thornton, B.A., M Rosenberg, E. Richman, W. Wang, Y Xie, J. Zhang et al. 2011. Achieving the 30% Goal: Energy and Cost Savings Analysis of ASHRAE Standard 90.1-2010. PNNL-20405. Richland, WA: Pacific Northwest National Laboratory. Winkelmann, F.C., B.E. Birdsall, W.F. Buhl, K.L. Ellington, A.E. Erdem, J.J.Hirsch, and S. Gates. 1993. DOE-2 Supplement, Version 2.1e. LBL34947. Berkeley, CA: Regents of the University of California, Lawrence Berkley Laboratory. 11
