Text I, 4-11
advertisement
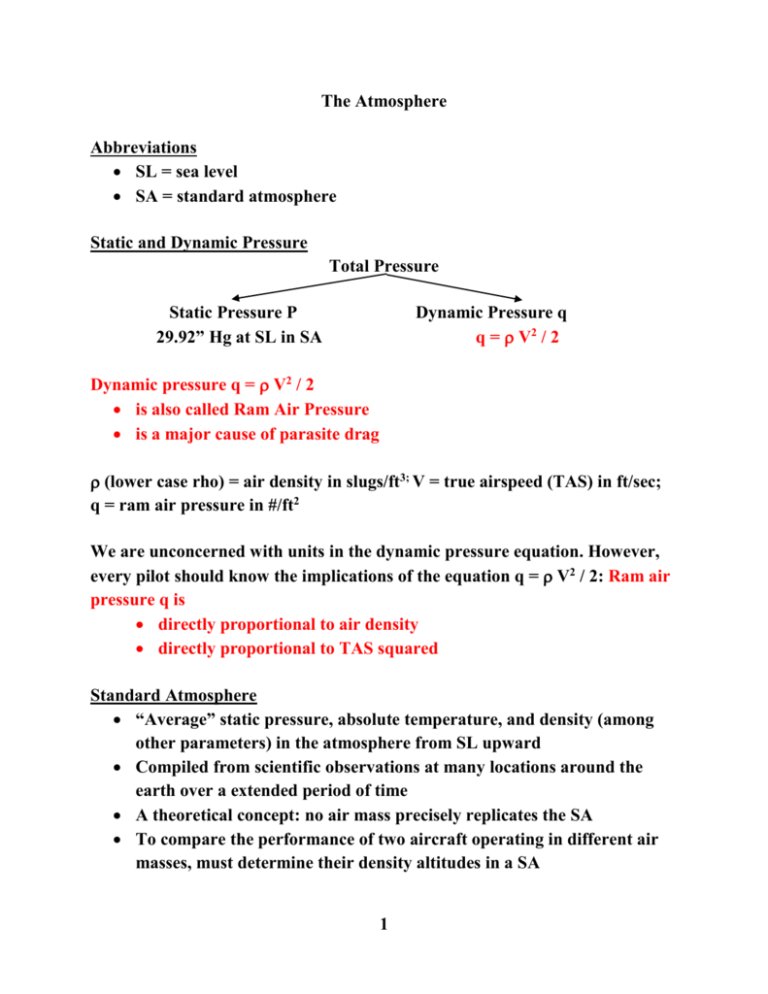
The Atmosphere Abbreviations SL = sea level SA = standard atmosphere Static and Dynamic Pressure Total Pressure Static Pressure P 29.92” Hg at SL in SA Dynamic Pressure q q = V2 / 2 Dynamic pressure q = V2 / 2 is also called Ram Air Pressure is a major cause of parasite drag (lower case rho) = air density in slugs/ft3; V = true airspeed (TAS) in ft/sec; q = ram air pressure in #/ft2 We are unconcerned with units in the dynamic pressure equation. However, every pilot should know the implications of the equation q = V2 / 2: Ram air pressure q is directly proportional to air density directly proportional to TAS squared Standard Atmosphere “Average” static pressure, absolute temperature, and density (among other parameters) in the atmosphere from SL upward Compiled from scientific observations at many locations around the earth over a extended period of time A theoretical concept: no air mass precisely replicates the SA To compare the performance of two aircraft operating in different air masses, must determine their density altitudes in a SA 1 Standard Atmosphere Table—a table listing atmospheric properties in a SA Use ONLY this SA Table in quiz and test calculations!!! 2 Pressure Ratio (small delta) in SA = P / P0 P is static pressure at your altitude P0 is static pressure at SL in SA (29.92” Hg) Lapse rate of P in a standard atmosphere is 1” Hg / 1000’ (this “rule of thumb is an accurate approximation in the lower atmosphere ONLY) Altitude (ft) 1000 5000 10000 20000 29920 Calculated Using Rule of Thumb 28.92 / 29/92 = 0.96658 24.92 / 29.92 = 0.83287 19.92 / 29.92 = 0.66576 9.92 / 29.92 = 0.33155 0 / 29.92 = 0.00000 Actual 0.96439 0.83205 0.68770 0.45954 0.29690 Temperature Ratio (theta) in SA = T / T0 T is absolute temperature at your altitude T0 is absolute temperature at SL in SA (288O Kelvin or 519O Rankine) KO = Co + 273O (e.g. 15O C + 273O C = 288O K) RO = FO + 460O ( e.g. 59O F + 460O F = 519O R) Lapse Rate of temperature in SA is about 2O C (3.6O F) /1000’ from SL to the tropopause. This approximation is highly accurate. Altitude (ft) 10000 20000 30000 Calculated Using 2O /1000’ Lapse Rate (-5+273) / (15+273) = 0.93056 (-25+273) / (15+273) = 0.86111 (-45+273) / (15+273) = 0.79167 3 Actual 0.93125 0.86249 0.79374 Suppose the temperature ratio at your altitude is 0.86249. Find the temperature in degrees F at this altitude in SA. T = T0 = (59 + 460)O R (0.86249) = 447.632O R T = 447.63O R – 460O = -12.367O F Density Ratio (small sigma) = / 0 is air density at your altitude 0 is air density at SL in SA No rule of thumb exists for the lapse rate of air density in SA. Relationship between Pressure, Temperature, and Density in SA =/ Example: FL350 / FL350 = 0.23530 / 0.75936 = 0.30987 = FL350 ( is a mathematical symbol that means “is proportional to”) =/= 𝑷⁄𝑷𝟎 𝑻 ⁄𝑻 𝟎 ∝ 𝑷⁄𝑻 Important: The equations = / reflects the fact that air density is Directly proportional to static air pressure Inversely proportional to absolute air temperature SMOE (Standard Means of Evaluation) SMOE = 1 / Some SA tables have a column for Some SA tables have a column for SMOE 4 Speed of Sound in Air a depends on air temperature T only (counterintuitive?) a = a0 where a0 = 661.74 nm/hr, the speed of sound at SL in SA Example: if = 0.79374, then a = a0 = 661.74 0.79374 = 589.56 nm/hr Mach Number M ratio of TAS to the speed of sound at cruise altitude M = TAS / a = TAS / (a0 ) Math Review: Linear vs. Non-Linear and Direct vs. Inverse Functions y = f(x)—a mapping from a domain x to a range y Linear : y changes at a constant rate with respect to x—results in a straight line plot Non-linear: y changes at a varying rate with respect to x—results in a curved line plot Direct (x, y; x, y)) Inverse (x, y; x, y) Examples: Linear, Direct: y = x Linear, Inverse: y = -x 5 Non-Linear: y = x2 Direct in1st Quadrant Inverse in 2nd Quadrant Variation of SA Parameters with Altitude , , are all inverse , are both non-linear; is linear (and has a discontinuity) a is linear inverse (and has a discontinuity) SMOE = 1 / is non-linear direct 0.0 < , , ≤ 1.0 in SA at SL and above 6 Altitude Measurement Indicated Altitude (IA)—read on the altimeter. To find altimeter error: Set field elevation on altimeter Read Kollsman window value Compare Kollsman value to reported altimeter setting Example: o Altimeter setting = 3.12 with field elevation set o Kollsman window reading = 3.15 o Altimeter error = 3.15 – 3.12 = + 0.03 o Set Kollsman window to next reported altimeter setting + 0.03 Pressure Altitude (PA)—IA corrected for non-standard static pressure P E6B / Flight Computer or use 1” Hg /1000’ rule of thumb Since P decreases as altitude increases (inverse function) o Non-standard high static pressure PA lower than IA o Non-standard low static pressure PA higher than IA o is a mathematical symbol that means “implies” Example 1: o IA = 35’ (field elevation); Altimeter setting = 30.14 o 30.14 – 29.92 = 0.22: corresponds to 0.22 (1000) = 220’ o PA = 35’ – 220’ = -185’ (subtract because pressure is nonstandard high, implying PA < IA) Example 2: o IA = 35’ (field elevation); Altimeter setting = 28.40 o 29.92 – 28.40 = 1.52: corresponds to 1.52 (1000) = 1520’ o PA = 35’ + 1520’ = 1555’ (add because pressure is non-standard low, implying PA > IA Density Altitude (DA) – PA corrected for non-standard temperature T Use an aviation computer or chart to make this correction Note: Since P/T, correcting IA for non-standard P and PA for nonstandard T is equivalent to correcting IA for non-standard density Thus, DA = IA corrected for non-standard air density 7 Use the chart below to find DA by correcting PA for temperature T Locate T on bottom horizontal scale Proceed vertically to intersect the curved PA line At the intersection, proceed horizontally to read o DA on left vertical scale o SMOE on right vertical scale Note: each small block on the left vertical-axis = 250’ of altitude T = -15o C; PA = 6000’ (non-standard low temperature) DA = 5000 – (4.5*250) = 3875’; SMOE = 1.05 Required Accuracy: ± 250’ DA, ± 0.01 SMOE 8
