SUPPLEMENTARY FigureS
advertisement
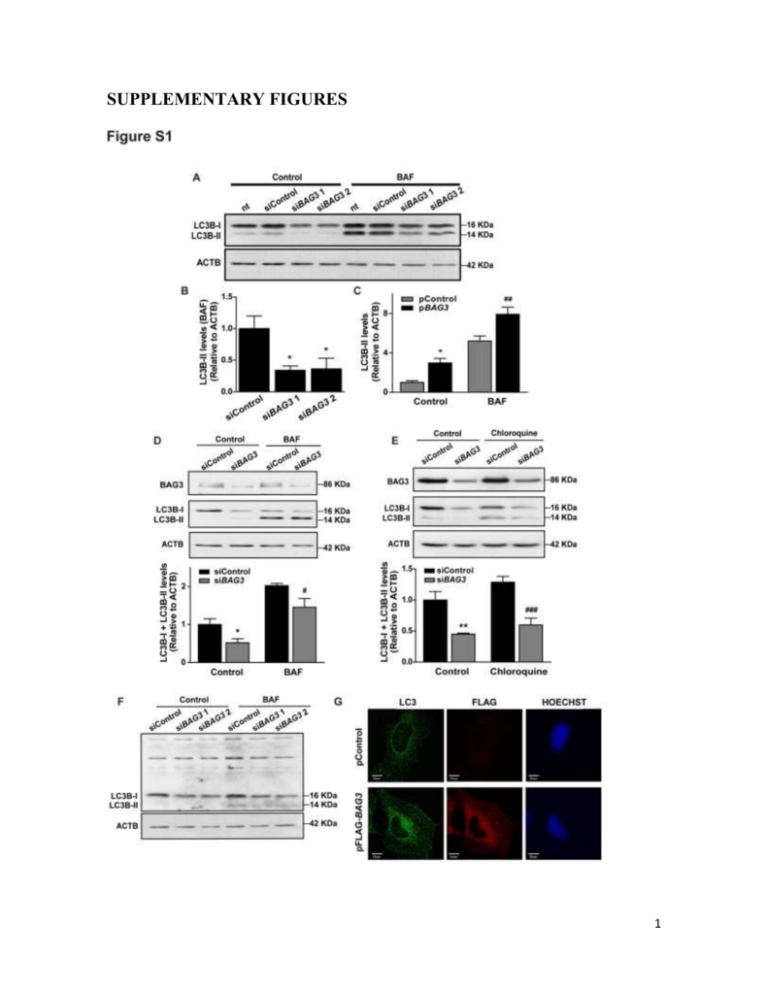
SUPPLEMENTARY FIGURES 1 Figure S1. Effect of BAG3 on LC3B protein levels. (A) Representative western blot of protein extracts from HeLa cells transfected with 2 BAG3 (siBAG3 1 and siBAG3 2) or control (siC) siRNAs. Where is indicated, bafilomycin A1 (BAF) (10 nM) was added during the last 5 h. Nontransfected (nt) cells are also shown. (B) Protein extracts from HeLa cells transfected with 2 BAG3 (siBAG3 1 and siBAG3 2) or control (siControl) siRNAs were analyzed by western blot. Cells were treated with BAF (10 nM) by 5 h. Quantification of LC3B-II normalized by ACTB is shown. (C) HeLa cells were transfected with control (pControl) or BAG3 (pBAG3) plasmids. Where is indicated, BAF (10 nM) was added during the last 5 h. Protein levels were analyzed by western blot and quantification of LC3B-II normalized by ACTB is shown. (D) HEK293 cells were transfected with control (siControl) or BAG3 (siBAG3) siRNAs. BAF (10 nM) was added during the last 5 h. Protein levels were analyzed by western blot. Representative images and quantification of total LC3B (LC3B-I plus LC3B-II) normalized by ACTB are shown. (E) HEK293 cells were transfected with control (siControl) or BAG3 (siBAG3) siRNAs. Hydroxychloroquine (30 µM) was added during the last 4 h. Protein levels were analyzed by western blot. Representative images and quantification of total LC3B (LC3B-I plus LC3B-II) normalized by ACTB are shown. (F) Representative western blot of HeLa cells transfected with control (siControl) or BAG3 (siBAG3) siRNAs. BAF (10 nM) was added during the last 5 h. The membrane was treated with an antibody against BAG3 donated by Dr. J. Hill (Division of Cardiology, University of Texas Southwestern Medical Center). (G) Immunofluorescence in HeLa cells transfected with BAG3-FLAG or control (pControl) plasmids. LC3B is shown in green, FLAG is shown in red and Hoechst in blue. Data are expressed as mean ± SEM of at least 3 independent experiments. Statistical significance was calculated using ANOVA 2 and Student t-test. *P<0.05; **P<0.01 vs control; #, P<0.05; ## , P<0.01 vs BAF-treated control; ###, P<0.001 vs hydroxychloroquine treated control. Scale bar, 20 µm. 3 Figure S2. Effect of BAG3 on the levels of ATG proteins. HeLa cells were transfected with control (siControl) or BAG3 (siBAG3) siRNAs. Protein levels were analyzed by western blot and quantification of ATG3 (A), ATG4B (C), ATG12–ATG5 (E), ATG7 (G) 4 normalized by ACTB are shown. Also, HeLa cells were transfected with control (pControl) or BAG3 (pBAG3) plasmids. Protein levels were analyzed by western blot and quantification of ATG3 (B), ATG4B (D), ATG12–ATG5 (F), ATG7 (H) normalized by ACTB are shown. Data are expressed as mean ± SEM of at least 3 independent experiments. Statistical significance was calculated using Student t-test. There were nonsignificant differences. 5 Figure S3. Effects of BAG3 on MTOR and AMPK phosphorylation. (A) HeLa cells were transfected with control (siControl) or BAG3 (siBAG3) siRNAs. (B) HeLa cells were transfected with control (pControl) or BAG3 (pBAG3) plasmids. Protein levels were analyzed by western blot. Representative images and quantification of pAMPK normalized by total AMPK and pMTOR normalized by total MTOR are shown. Data are expressed as 6 mean ± SEM of at least 3 independent experiments. Statistical significance was calculated with Student t-test. There were nonsignificant differences. 7 Figure S4. Controls for lysosomal and proteasomal activity determinations. (A) HeLa cells were treated with NH4Cl (5 mM) by 5 h and incubated with LysoTracker Green (50 nM). Fluorescence was evaluated by flow cytometry. The representative histograms show the average value of fluorescence. (B) HeLa cells transfected with a control siRNA, were also transfected with GFPµ plasmid and treated with MG132 (5 µM) during the last 5 h. Fluorescence was evaluated by flow cytometry and its quantification is shown. UBB (ubiquitin B) is shown as control for MG132. Data are expressed as mean ± SEM of at least 8 3 independent experiments. Statistical significance was calculated with Student t-test, **P<0.01 vs control. 9 10 Figure S5. Effect of BAG3 knockdown on mRNA levels of mammalian orthologs of yeast Atg8. (A) HeLa cells were treated with 3 µg/mL actinomycin D by 6 h. Total RNA was isolated and MAP1LC3B, BAG3, SQSTM1/p62, HSPA9/mtHSP75 (heat shock 70kDa protein 9 [mortalin]) and TRAP1/HSP90L (TNF receptor-associated protein 1) mRNAs were quantified by RT-qPCR. Data are expressed as mean ± SEM of at least 3 independent experiments. Statistical significance was calculated with Student t-test, *, P<0.05; **, P<0.01 vs nontreated control. (B) Representative confocal images of the Click chemistry assay for the quantification of global RNA transcription using an alkyne-modified nucleoside EU (5-ethynyl uridine) coupled to an azide-derivatized fluorophore. Scale bar: 40 M. HeLa cells were treated with 3 µg/mL actinomycin D for 6 h. Data are expressed as mean ± SEM of 4 experiments. Statistical significance was calculated with Student t-test, **, P<0.01 vs nontreated control. (C) HeLa cells were transfected with control (siControl) or BAG3 (siBAG3) siRNAs. Total RNAs were isolated. mRNAs of mammalian orthologs of yeast Atg8 (including the LC3 family) were quantified by RT-qPCR. Data are expressed as fold of change relative to pControl and correspond to mean ± SEM of at least 3 independent experiments. Statistical significance was calculated using Student t-test. *, P<0.05 vs. pControl; ns: nonsignificant vs pControl. 11 Figure S6. Controls for translation inhibition. (A) HeLa cells were treated with 10 µg/mL cycloheximide (CHX) by 1 h, 2 h, 4 h, 6 h and 8 h. Protein levels were analyzed by western blot. Representative images show BAG3, TP53 (p53), LC3B (LC3B-I and LC3B-II) and 12 ACTB. (B) Representative confocal images of the Click chemistry assay for the quantification of total protein translation global using L-homopropargylglycine (HPG), a methionine alkyne analog; and Alexa Fluor® 488 azide. Scale bar: 40 m. HeLa cells were treated with 10 µg/mL cycloheximide (CHX) by 6 h. Data are expressed as mean ± SEM of 4 experiments. Statistical significance was calculated with Student t-test, **, P<0.01 vs nontreated control. (C) Representative immunofluorescence in HeLa cells treated with sodium arsenite (0.2 mM) by 6 h. G3BP is shown in green and Hoechst in blue. (D) HeLa cells were transfected with control (pControl) or BAG3 (pBAG3) plasmids. In addition, cells were treated with cycloheximide (10 µg/mL) by 6 h or sodium arsenite (0.2 mM) by 6 h. Quantification of nonpermeabilized and propidium iodide positive cells is shown. Determination was done by flow cytometry. (E) HeLa cells were treated as in (D). Apoptosis was determined in permeabilized cells using propidium iodide and flow cytometry. Data are expressed as mean ± SEM of at least 3 independent experiments. Statistical significance was calculated with ANOVA test. There were nonsignificant differences. 13

