Logistic Equation Worksheet: Population Growth & Limits
advertisement
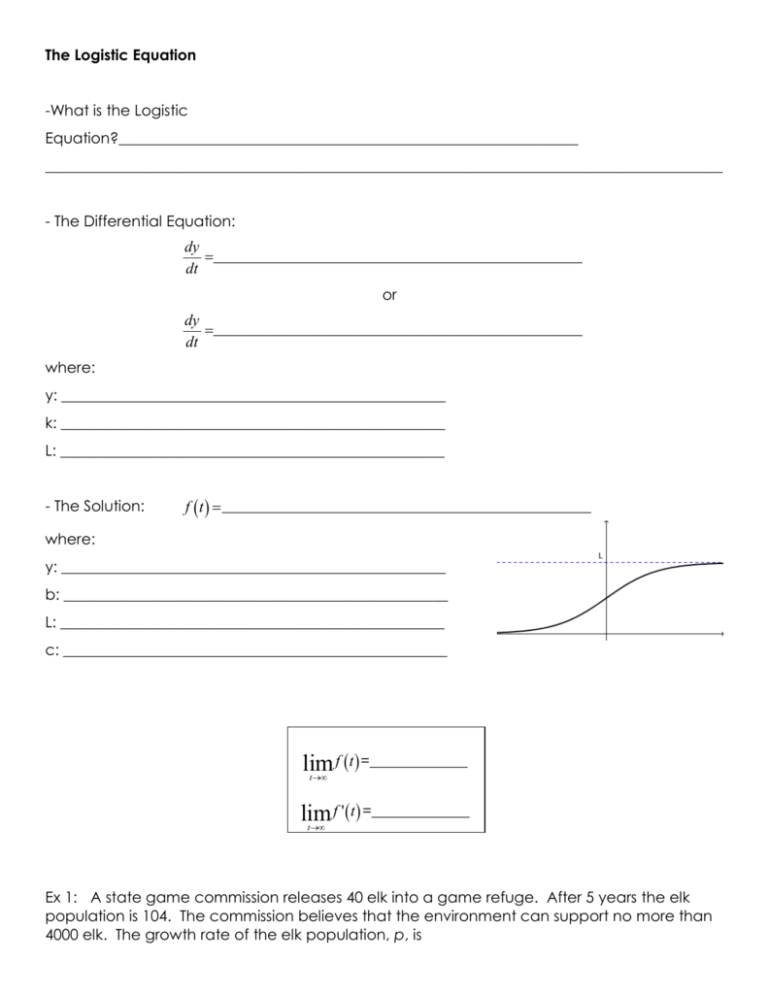
The Logistic Equation -What is the Logistic Equation?_____________________________________________________________ __________________________________________________________________________________________ - The Differential Equation: dy =_________________________________________________ dt or dy =_________________________________________________ dt where: y: ___________________________________________________ k: ___________________________________________________ L: ___________________________________________________ - The Solution: f ( t ) = _________________________________________________ where: y: ___________________________________________________ b: ___________________________________________________ L: ___________________________________________________ c: ___________________________________________________ lim f (t ) =_____________ t®¥ lim f ' (t ) =_____________ t®¥ Ex 1: A state game commission releases 40 elk into a game refuge. After 5 years the elk population is 104. The commission believes that the environment can support no more than 4000 elk. The growth rate of the elk population, p, is æ dP p ö = kpç1÷, è 4000 ø dt 40 £ p £ 4000 a) Write a model for the elk population in terms of t. b) Use the model to estimate the elk population after 15 years. Round to the nearest elk. c) Find the limit of the model as . Ex 2: The growth rate of a population, p, of deer in a newly established wild-life is modeled by the differential equation dP = 0.008P (100 - P ) dt a) What is the carrying capacity for deer? b) What is the deer population when the population is growing the fastest? c) What is the rate of change of the population when it is growing the fastest? Ex 3: Ex 4: Suppose the population of bears in a national park grows according to the logistic dP differential equation = 5P - 0.002P 2 , where P is the number of bears at time t in years. dt a) If P(0)=100, then limP (t ) =? For what values of P is the graph of P increasing? t®¥ Decreasing? Explain. b) If P(0)=1500, then limP ( t ) =? For what values of P is the graph of P increasing? t®¥ Decreasing? Explain. c) If P(0)=3000, then limP ( t ) =? For what values of P is the graph of P increasing? t®¥ Decreasing? Explain. Ex: 5 A conservation organization releases 25 Florida Panthers into a game refuge. After 2 years, there are 39 panthers in the preserve. The Florida preserve has a carrying capacity of 200 panthers. a) Write a logistic equation that models the population of panthers in the preserve. b) Find the population after 5 years. c) When will the population reach 100? d) At what time is the panther population growing most rapidly? Ex 6: Ex: 7 Ex 8: Ex 9: Ex 10: ANSWERS 1. 4000 1+ 99e-0.194t b) 629 c) 4000 a) y = 2. a) 100 b) 50 c) 20 3. 2 a) y = e- x +6 x-8 b) limg ( x ) = 3, t®¥ 3 dy c) y = , 2 dx 4. a) limg' ( x) = 0 t®¥ = y=3/2 9 2 limP (t ) = 2500 , For t>0 the graph of P is increasing since the initial condition is less than the t®¥ carrying capacity. b) limP (t ) = 2500 , For t>0 the graph of P is increasing since the initial condition is less than the t®¥ carrying capacity. c) limP (t ) = 2500 , For t>0 the graph of P is decreasing since the initial condition is more than t®¥ the carrying capacity. 5. 200 1+ 7e-0.264t b) 69.695 c) 7.369 years d) 7.369 years a) y = 6. D 7. E 8. C 9. B 10. a) limP (t ) =12 (for both limits) t®¥ b) 6 c) y = 3e d) 0 1æ t 2 ö ç t- ÷ 5çè 24 ÷ø

