Linear Functions
advertisement
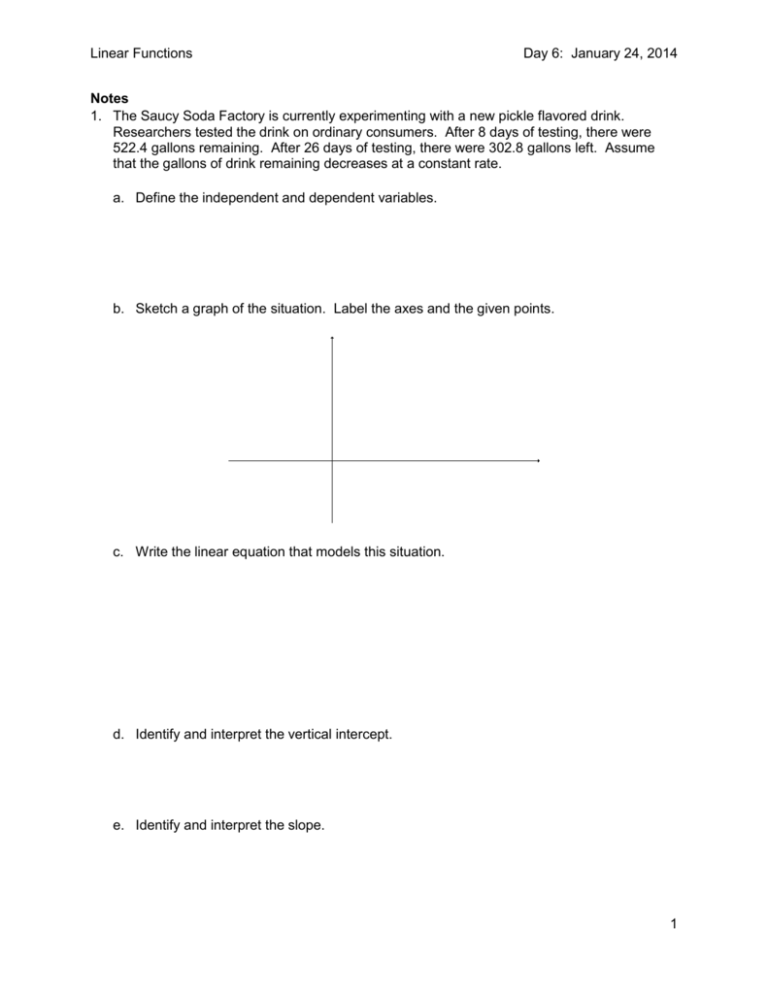
Linear Functions Day 6: January 24, 2014 Notes 1. The Saucy Soda Factory is currently experimenting with a new pickle flavored drink. Researchers tested the drink on ordinary consumers. After 8 days of testing, there were 522.4 gallons remaining. After 26 days of testing, there were 302.8 gallons left. Assume that the gallons of drink remaining decreases at a constant rate. a. Define the independent and dependent variables. b. Sketch a graph of the situation. Label the axes and the given points. c. Write the linear equation that models this situation. d. Identify and interpret the vertical intercept. e. Identify and interpret the slope. 1 Linear Functions Day 6: January 24, 2014 2. The median weight for female infants grows linearly over time. After 5 months, the median weight for female infants is 14.5 pounds. After 9 months, the median weight for female infants is 20.5 pounds. a. Define the variables. b. Using function notation, write the linear function to model this situation. c. What is the median weight for female infants at birth? d. On average, how much weight does a female infant gain each month? 3. Given the tables below, determine which functions are linear. x f x x g x x hx x j x −1 0 1 2 8 3 −2 −7 0 1 2 3 6 6 6 6 3 8 13 18 15.6 21.6 27.6 33.6 −2 0 2 4 1 3 9 27 4. Write the equation for all linear functions from #3. 2 Linear Functions Day 6: January 24, 2014 Domain and Range Worksheet 1. Determine the domain and range for the functions below using correct notation. a. 7 6 5 4 3 2 1 -5 -4 -3 -2 -1 -1 -2 -3 -4 -5 -6 -7 y x 1 2 3 4 5 Domain: Range: b. The Saucy Soda Factory Question (#1). Domain: Range: c. t −1 3 7 10 D(t) 2 4 5 8 Domain: Range: 2. You have decided to go into the t-shirt business. You’ve determined that it will cost $35 to get started and will cost $5 to make each t-shirt. You can only make 100 t-shirts. a. Write the equation for the cost, C, as a function of the number of t-shirts made, n. b. Identify the domain for the function from part a given the context of the situation. c. Identify the range for the function from part a given the context of the situation. 3 Linear Functions Day 6: January 24, 2014 3. The relationship between the number, N, of dogs in an animal shelter t years after 2000 can be represented by the following table: t: Time in years after 2000 N: Number of dogs in the animal shelter 4 280 11 0 a. Write the linear equation to represent this situation, where the number of dogs in the animal shelter is a function of the time in years after 2000. Show all work and use function notation. b. Interpret the slope within the context of the situation. c. Identify the vertical intercept. d. Interpret the vertical intercept within the context of the situation. e. Identify the horizontal intercept. f. Interpret the horizontal intercept within the context of the situation. g. Identify the domain for this situation. h. Identify the range for this situation. 4
