Annual Environmental Review Template
advertisement
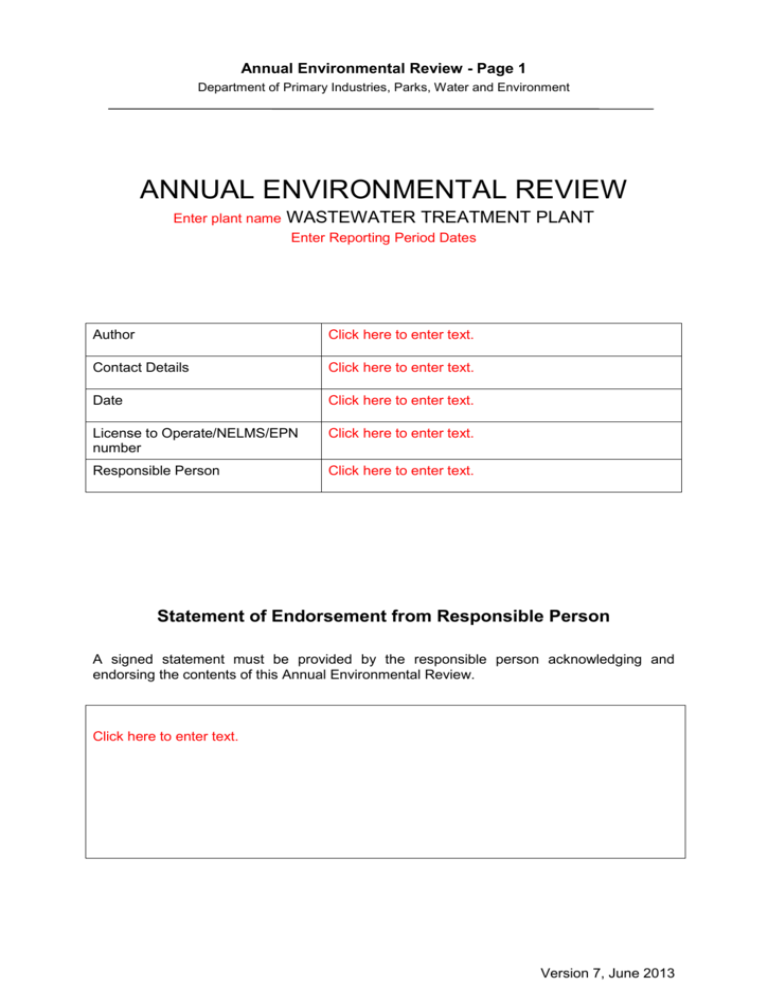
Annual Environmental Review - Page 1 Department of Primary Industries, Parks, Water and Environment ANNUAL ENVIRONMENTAL REVIEW Enter plant name WASTEWATER TREATMENT PLANT Enter Reporting Period Dates Author Click here to enter text. Contact Details Click here to enter text. Date Click here to enter text. License to Operate/NELMS/EPN number Click here to enter text. Responsible Person Click here to enter text. Statement of Endorsement from Responsible Person A signed statement must be provided by the responsible person acknowledging and endorsing the contents of this Annual Environmental Review. Click here to enter text. Version 7, June 2013 Annual Environmental Review - Page 2 Department of Primary Industries, Parks, Water and Environment Contents Section A: General Notes ...................................................................................................... 4 Section B: Permit/EPN and Activity Details ........................................................................... 5 B1 Permit/EPN Holder.................................................................................................................. 5 B2 Activity / Activities to which this Report Relates ................................................................... 5 B3 Activity Details ........................................................................................................................ 6 Section C: Monitoring Summary ............................................................................................ 7 C1 Flow ......................................................................................................................................... 7 C2 Effluent Concentration.......................................................................................................... 11 C3 Mass Load ............................................................................................................................. 14 C4 Ambient Monitoring ............................................................................................................. 15 C5 Sewage Sludge and Biosolids ................................................................................................ 17 Section D: Compliance........................................................................................................ 19 D1 Compliance with Flow Limits ................................................................................................ 19 D2 Compliance with Discharge Concentration Limits ................................................................ 19 D3 Compliance with Reporting and Planning Requirements ..................................................... 23 D4 Summary of Compliance with Permit Conditions ................................................................. 23 D5 Reuse annual reporting ......................................................................................................... 25 Section E: Incidents and Complaints ................................................................................... 26 E1 Notifiable Incidents under section 32, EMPCA ......................................................................... 26 E2 Complaints against the Activity ................................................................................................ 28 Section F: Additional Commitments .................................................................................... 29 F1 Review of Development Proposal and Environmental Management Plan (DPEMP) & Environmental Management Plan (EMP) ......................................................................................... 29 Appendix 1: Calculation of Mass Loads .............................................................................. 30 General.......................................................................................................................................... 30 Monitoring of discharge concentration ........................................................................................ 30 Flow monitoring ............................................................................................................................ 30 Calculating actual pollutant loads discharged to waters .............................................................. 30 Version 7, June 2013 Annual Environmental Review - Page 3 Department of Primary Industries, Parks, Water and Environment Use the checklist below to ensure that you have completed your ANNUAL ENVIRONMENTAL REVIEW correctly (all boxes should be marked). CHECKLIST check check check check check check check check check check check check check check check check Cover Cover identification details completed Cover The Annual Environmental Review has been signed by the appropriate person(s) and, if applicable, the revised reporting period entered Section B1 All permit / EPN details are entered and correct Sections B2-B3 You have entered / updated the activity description and status Section C1 Flow information provided Section C2 Concentration information provided Section C3 Mass load information provided Section C4 Ambient monitoring information provided Section C5 Sewage sludge and biosolids information provided Section D1 You have checked compliance with flow limits Section D2 Compliance tables completed for all regulatory parameters Section D2 You have provided a written summary and associated graphical representations regarding compliance with discharge limits Section D3-D4 Other compliance details completed Section D5 Have you submitted your annual reporting for reuse where required. Section E1-E2 You have summarised incidents complaints Section F1 You have answered the questions outlined in this section Make a copy of the completed Annual Environmental Review and keep it with check your environmental conditions / permit Version 7, June 2013 Annual Environmental Review - Page 4 Department of Primary Industries, Parks, Water and Environment Section A: General Notes 1. Your Annual Environmental Review must be completed and submitted to the Director, Environment Protection Authority, within 3 months of the end of the reporting period. The reporting period is 1 July to 30 June. 2. Please note this document will be treated as a publicly available document i.e. 1. will be made available to the public on request; and / or 2. may be referenced in the EPA Division’s Annual Report; and/ or 3. may be published on the EPA Division’s webpage; and /or 4. may be incorporated into the annual Water and Sewerage State of the Industry Report. 3. An electronic copy of this form is available from the Wastewater Section of the EPA Division. 4. All sections must be completed or marked “n/a” where applicable. Please email the completed report to: wastewater@environment.tas.gov.au or post it to: The Director, Environment Protection Authority. GPO 1550 Hobart TAS 7000 Version 7, June 2013 Annual Environmental Review - Page 5 Department of Primary Industries, Parks, Water and Environment Section B: Permit/EPN and Activity Details B1 Permit/EPN Holder Responsible Person identified in Permit/EPN: Click here to enter text. Trading Name: Click here to enter text. ABN Number: Click here to enter text. Postal Address of responsible person: Click here to enter text. Phone Number of responsible person: Click here to enter text. Email Address of responsible person: Click here to enter text. B2 Activity / Activities to which this Report Relates Permit Reference Number (use Planning Authority’s DA number or EPA Division reference number, e.g. Licence to Operate Scheduled Activity, Permit Conditions - Environmental) Date of Issue Click here to enter text. EPN EPN Numbers If more than one EPN provide all numbers Date of Issue Click here to enter text. Activity Description1 Click here to enter text. Activity Name (if any) Click here to enter text. Activity Address Click here to enter text. Contact Person Click here to enter text. Note In some cases, several planning permits and / or EPNs may exist in relation to a Level 2 Wastewater Treatment Plant1. Details are required in relation to each permit or EPN issued for the activity. 1 Defined in EMPCA, Schedule 2, Part 3 as: the conduct of wastewater treatment works that involve the discharge of treated or untreated sewage, septic tank effluent or industrial or commercial wastewater to land or water, being works with a design capacity to treat an average dry-weather flow of 100 kilolitres or more per day of sewage or wastewater. Version 7, June 2013 Annual Environmental Review - Page 6 Department of Primary Industries, Parks, Water and Environment B3 Activity Details 1. Provide a summary of any noteworthy changes to materials, structures, equipment or processes used in the course of carrying out the activity during the reporting period, and the date when those changes took effect. Where changes may have caused or increased the emission of a pollutant or otherwise resulted in environmental harm, provide the date that written approval for the change was granted. Click here to enter text. 2. Provide a description of significant inputs of commercial and industrial wastewater and tankered waste to the activity during the reporting period. Include any significant change to those inputs when compared to the previous reporting period, including types, sources, estimated quantities (where available) and key contaminants. Click here to enter text. Version 7, June 2013 Annual Environmental Review - Page 7 Department of Primary Industries, Parks, Water and Environment Section C: Monitoring Summary C1 Flow The following monitoring information must be provided for the reporting period: 1. The influent flow limits specified in your permit / EPN Average Dry Weather Flow (kL/day) Click here to enter text. Peak Wet Weather Flow (kL/day) Click here to enter text. 2. Average daily flow to the activity for each calendar month Month Average Daily Influent Volume (kL/day) July Click here to enter text. August Click here to enter text. September Click here to enter text. October Click here to enter text. November Click here to enter text. December Click here to enter text. January Click here to enter text. February Click here to enter text. March Click here to enter text. April Click here to enter text. May Click here to enter text. June Click here to enter text. Version 7, June 2013 Annual Environmental Review - Page 8 Department of Primary Industries, Parks, Water and Environment 3. Graphical representation of measured influent flow against flow limits and rainfall If suitable data is available, provide a graphical representation of the reporting period showing measured inflow (in ML/day), ADWF limit, PWWF limit if specified on your permit/EPN and rainfall as measured at a relevant gauging station Location and site ID of rainfall gauge used Click here to enter text. Version 7, June 2013 Annual Environmental Review - Page 9 Department of Primary Industries, Parks, Water and Environment 3. Total effluent volumes discharged from the activity each calendar month, based on daily measured flows: Month 4. Discharge to Waters Total Effluent Volume (ML) Discharge to Land (Reuse) Total Effluent Volume (ML) July Click here to enter text. Click here to enter text. August Click here to enter text. Click here to enter text. September Click here to enter text. Click here to enter text. October Click here to enter text. Click here to enter text. November Click here to enter text. Click here to enter text. December Click here to enter text. Click here to enter text. January Click here to enter text. Click here to enter text. February Click here to enter text. Click here to enter text. March Click here to enter text. Click here to enter text. April Click here to enter text. Click here to enter text. May Click here to enter text. Click here to enter text. June Click here to enter text. Click here to enter text. TOTAL ANNUAL Click here to enter text. Click here to enter text. Total annual volume of treated effluent discharged at each authorised discharge point, based on measured daily flows: Name of Discharge Point Click here to enter text. Click here to enter text. Volume of effluent discharged (ML and %) Click here to enter text. Click here to enter text. Version 7, June 2013 Annual Environmental Review - Page 10 Department of Primary Industries, Parks, Water and Environment 5. Provide a description of the type of flow monitoring equipment or estimation method used to measure influent and effluent flows during the reporting period. Use additional rows where there is more than one measured stream of influent or effluent. Do not include by-passes in this section. Influent Method of measurement or calculation Click here to enter text. (For example, magnetic flow meter, estimation based on pump station operational times) Click here to enter text. Click here to enter text. Click here to enter text. Click here to enter text. Click here to enter text. Click here to enter text. Click here to enter text. Click here to enter text. Effluent Method of measurement or calculation Click here to enter text. Click here to enter text. Click here to enter text. Click here to enter text. Click here to enter text. Click here to enter text. Click here to enter text. Click here to enter text. Version 7, June 2013 Annual Environmental Review - Page 11 Department of Primary Industries, Parks, Water and Environment C2 Effluent Concentration For each regulatory monitoring point specified in your Permit/EPN, complete the details for each pollutant listed in the table (or tables) below. Where there are multiple authorised discharge points, provide information in relation to each one. Note: If the wastewater treatment plant has discharge limits within its Permit or EPN that are not listed in the tables below, please include these parameters. 1. Discharge to Waters – Monthly Monitoring Parameters Name of Monitoring Point : Click here to enter text. Pollutant Units No. of samples required in permit/EPN BOD5 mg/L Number Number Value Value Value NFR/SS mg/L Number Number Value Value Value TC cfu/100 mL Number Number Value Value Value O&G mg/L Number Number Value Value Value TN mg/L Number Number Value Value Value Ammonia mg/L Number Number Value Value Value TP mg/L Number Number Value Value Value pH minimum result recorded pH mean of sample results pH maximum result recorded Value Value Value pH Number No. of samples collected & analysed 50th%ile value of sample results 90th%ile value of sample results Maximum value of sample results Number Version 7, June 2013 Annual Environmental Review - Page 12 Department of Primary Industries, Parks, Water and Environment 2. Discharge to Waters – Annual Monitoring Parameters Name of Monitoring Point : Click here to enter text. Pollutant Units Value of sample result Click here to enter text. Unit Value Click here to enter text. Unit Value Click here to enter text. Unit Value Click here to enter text. Unit Value Click here to enter text. Unit Value Click here to enter text. Unit Value Click here to enter text. Unit Value Click here to enter text. Unit Value Click here to enter text. Unit Value Click here to enter text. Unit Value Click here to enter text. Unit Value Click here to enter text. Unit Value Click here to enter text. Unit Value Click here to enter text. Unit Value Click here to enter text. Unit Value Click here to enter text. Unit Value Click here to enter text. Unit Value Click here to enter text. Unit Value Click here to enter text. Unit Value Click here to enter text. Unit Value Click here to enter text. Unit Value Click here to enter text. Unit Value Click here to enter text. Unit Value Click here to enter text. Unit Value Version 7, June 2013 Annual Environmental Review - Page 13 Department of Primary Industries, Parks, Water and Environment 3. Discharge to Land / Effluent Reuse Pollutant Unit No. samples required in EPN No. samples collected & analysed Minimum value 50th %ile value Maximum value TC cfu/100 mL Number Number Value Value Value BOD5 mg/L Number Number Value Value Value pH minimum result recorded pH mean of sample results pH maximum result recorded Value Value Value pH Number Number Version 7, June 2013 Annual Environmental Review - Page 14 Department of Primary Industries, Parks, Water and Environment C3 Mass Load Mass Loads of Total Nitrogen and Total Phosphorus discharged to waterways from the activity must be calculated and reported annually using the formula contained in Appendix 1 (Calculation of Mass Loads) and entered into the table below. Select the appropriate option below as to whether a time weighted or flow weighted approach has been adopted. Mass load calculations should be based on the reported concentration of each sample multiplied by the flow measured on the day of sampling. If the quantity entered in the table is greater than the Permit/EPN Limit, the person responsible must detail the cause of this noncompliance in Section D. Attach your calculation spreadsheet as an Appendix. Note: When a sample is reported as below detection limit for the test, half of the detection limit value should be assigned to that sample for load calculation principles. Where 50% of sample results for a particular pollutant are below the detection limit, zero may be reported for those samples. This applies to samples collected during the reporting period. Note: Where applicable, the mass load limits are contained in the Permit/EPN. 1. Mass Load Nominate the method you adopted (delete the method not used): Time weighted approach or Flow weighted approach Parameter Unit Quantity Discharged Limit Total Phosphorus kg/yr Click here to enter text. Click here to enter text. Total Nitrogen kg/yr Click here to enter text. Click here to enter text. If the sample sets upon which these calculations are based were not complete, provide an explanatory note indicating how many samples were missing and which time period they related to. If the number of samples available is less than 50% of the required number of samples for a parameter, leave the associated ‘quantity discharged’ field blank. Version 7, June 2013 Annual Environmental Review - Page 15 Department of Primary Industries, Parks, Water and Environment C4 Ambient Monitoring If ambient monitoring was required during the reporting period, then complete the following tables: 1. Ambient monitoring – biological Purpose of Monitoring Program For example: Impacts within mixing zone; control outside mixing zone Short Description of Monitoring Program For example: scope, purpose, proposed changes A summary of the key findings Click here to enter text. Action statement A statement regarding proposed changes, if any, to the management of the activity identified on the basis of the ambient monitoring, and associated indicative implementation time frames 2. Ambient monitoring – groundwater Purpose of Monitoring Program For example: Detecting lagoon leakage Short Description of Monitoring Program For example: scope, purpose, proposed changes A summary of the key findings Click here to enter text. Action statement A statement regarding proposed changes, if any, to the management of the activity identified on the basis of the ambient monitoring, and associated indicative implementation time frames Version 7, June 2013 Annual Environmental Review - Page 16 Department of Primary Industries, Parks, Water and Environment 3. Ambient monitoring – physico-chem / microbiological Purpose of Monitoring Program For example: Impacts within mixing zone; control outside mixing zone Short Description of Monitoring Program For example: scope, purpose, proposed changes A summary of the key findings Click here to enter text. Action statement A statement regarding proposed changes, if any, to the management of the activity identified on the basis of the ambient monitoring, and associated indicative implementation time frames 4. Ambient monitoring – sediment Purpose of Monitoring Program For example: Impacts within mixing zone; control outside mixing zone Short Description of Monitoring Program For example: scope, purpose, proposed changes A summary of the key findings Click here to enter text. Action statement A statement regarding proposed changes, if any, to the management of the activity identified on the basis of the ambient monitoring, and associated indicative implementation time frames 5. Ambient monitoring – ecotoxicological Purpose of Monitoring Program For example: Impacts within mixing zone; control outside mixing zone Short Description of Monitoring Program For example: scope, purpose, proposed changes A summary of the key findings Click here to enter text. Action statement A statement regarding proposed changes, if any, to the management of the activity identified on the basis of the ambient monitoring, and associated indicative implementation time frames Version 7, June 2013 Annual Environmental Review - Page 17 Department of Primary Industries, Parks, Water and Environment C5 Sewage Sludge and Biosolids Provide a summary of the quantities of sewage sludge removed from the WWTP, a list of destinations to which the sewage sludge was delivered and the contaminant and stabilisation grading of that sewage sludge determined in accordance with the Tasmanian Biosolids Reuse Guidelines 1999 (TBRGs). Please note that the while the TBRGs state that lagoons need only be sampled prior to emptying, periodic sampling during operation of the lagoon can be undertaken to monitor contaminant concentrations, which would give prior warning of any contamination problems. Se Zn mg/kg mg/ kg mg/ kg mg/k g mg/ kg mg/kg mg/kg mg/kg mg/kg mg/kg PCBs Ni BHC Hg Lindane Pb HCB Cu Heptachlor Cr (tota l) Chlordane Cd Dieldrin Units (dry weight basis) As Aldrin Summary statistics of samples required to be taken in accordance with TBRGs during the reporting period – contaminants (if operating under an approved Sludge Management Plan, update this list to reflect the requirement s of that plan) DDT/DDD/DDE 1. mg/ kg mg/ kg mg/ kg mg/ kg mg/ kg mg/ kg mg/ kg mg/ kg No. Samples in the reportin g period Maximu m Arithme tic mean (averag e) Minimu m Version 7, June 2013 Annual Environmental Review - Page 18 Department of Primary Industries, Parks, Water and Environment BACC 2. Sludge end use (reuse or disposal) or further treatment (add additional rows as needed). In cases where sludge has been sent to a different WWTP for further treatment, it is only necessary to report quantity and fate and location where further treatment is to be undertaken. Date 3. Quanti ty (dry solid tonnes ) Solids content % w/v Stabilisation method Stabilisati on Grade Contamina nt Grade Biosolid Classificati on End use / fate & location Storage of biosolids at the WWTP stored on the land at the end of the reporting period Quantity of sewage sludge and biosolids stored on the land at the end of the reporting period (dry solid tonnes ) excluding sludge in lagoons. 4. Lagoon desludging (for lagoons only, add additional rows if more than 1 lagoon) Date of last lagoon sludge level assessment. Summarise findings & recommendations of that assessment. 5. Proposed date of next lagoon sludge level assessment Proposed date of next desludging Comments Version 7, June 2013 Annual Environmental Review - Page 19 Department of Primary Industries, Parks, Water and Environment Section D: Compliance D1 Compliance with Flow Limits Number of days on which the daily maximum throughput requirement (peak wet weather flow) was exceeded: 1. No. days on which throughput requirement was exceeded Click here to enter text. D2 Compliance with Discharge Concentration Limits Compliance assessment method A comparison of monitoring results against the limits specified in the environmental conditions of the permit must be provided in the table below. Compliance should be calculated as the number of samples complying with specified limits for individual parameters, expressed as a percentage of the total number of samples. This test is to be performed against each relevant limit, i.e. against the median, 90th percentile and maximum limits. An interpretation of monitoring results and compliance evaluation parameters should also be provided, accompanied by graphical representations where possible. Results of previous reporting periods should be included for comparison purposes. Discussion of any significant trends observable in the monitoring results and in the level of compliance over time must be provided. Note: Where separate limits exist for discharge to waters vs. discharge to land (reuse scheme), compliance must be assessed separately against both sets of limits. The volume of effluent discharged to land and to waters must be reported so that a flow-weighted compliance assessment can be undertaken. Note: Should it be required, an electronic copy of an Excel spreadsheet is available upon request from the EPA Division to help undertake these calculations. Please note that a copy of this completed spreadsheet may be appended to the AER in lieu of the table below. Note: If the wastewater treatment plant has discharge limits within its Permit or EPN that are not listed in the table below, please include these parameters. Version 7, June 2013 Annual Environmental Review - Page 20 Department of Primary Industries, Parks, Water and Environment Compliance against Limits for Discharge to Waters (fill in relevant fields in table). 1. Compliance summary statistics – discharge to water Parameter Type Limit Biochemical Oxygen Demand (5 day) (mg/L) Numerical Limit(s) Number of Samples Number of Samples Complying with Limit(s) % Compliance Max Value Value Value Value Biochemical Oxygen Demand (5 day) (mg/L) 90th %ile Value Value Value Value Biochemical Oxygen Demand (5 day) (mg/L) 50th %ile Value Value Value Value Non-filterable Residue Suspended Solids (mg/L) / Max Value Value Value Value Non-filterable Residue Suspended Solids (mg/L) / 90th %ile Value Value Value Value Non-filterable Residue Suspended Solids (mg/L) / 50th %ile Value Value Value Value Thermotolerant Coliforms (cfu/100 mL) Max Value Value Value Value Thermotolerant Coliforms (cfu/100 mL) 90th %ile Value Value Value Value Thermotolerant Coliforms (cfu/100 mL) 50th %ile Value Value Value Value Oil & grease (mg/L) Max Value Value Value Value Oil & grease (mg/L) 90th %ile Value Value Value Value Oil & grease (mg/L) 50th Value Value Value Value Total Nitrogen (mg/L) Max Value Value Value Value Total Nitrogen (mg/L) 90th %ile Value Value Value Value Total Nitrogen (mg/L) 50th %ile Value Value Value Value Ammonia – Nitrogen (mg/L) Max Value Value Value Value Ammonia – Nitrogen (mg/L) 90th %ile Value Value Value Value Ammonia – Nitrogen (mg/L) 50th %ile Value Value Value Value Total Phosphorus (mg/L) Max Value Value Value Value Total Phosphorus (mg/L) 90th %ile Value Value Value Value Total Phosphorus (mg/L) 50th %ile Value Value Value Value pH Max Value Value Value Value pH Min Value Value Value Value %ile of Version 7, June 2013 Annual Environmental Review - Page 21 Department of Primary Industries, Parks, Water and Environment 2. Interpretation of compliance summary statistics - discharge to water Interpretation of results Explanatory notes Graphs Trend analysis Actions to address non-compliance (implemented or proposed) Compliance against Limits for Discharge to Reuse Scheme (fill in relevant fields in table) 3. Compliance summary statistics – reuse Note The limits shown in the table below are default values for ‘Class B’ Effluent Reuse Schemes. The limits can be modified to be consistent with the particular reuse scheme under consideration. Parameter Type Limit BOD (mg/L) of Numerical Limit(s) Number of Samples Number of Samples Complying with Limit(s) % Compliance Max 50 Value Value Value Thermotolerant Coliforms (cfu/100 mL) Median 1,000 Value Value Value Thermotolerant Coliforms (cfu/100 mL) Max 10,000 Value Value Value pH Max 6.5 Value Value Value pH Min 8.5 Value Value Value Version 7, June 2013 Annual Environmental Review - Page 22 Department of Primary Industries, Parks, Water and Environment 4. Interpretation of compliance summary statistics - reuse Interpretation of results Explanatory notes Graphs Trend analysis Actions to address non-compliance (implemented or proposed) Version 7, June 2013 Annual Environmental Review - Page 23 Department of Primary Industries, Parks, Water and Environment D3 Compliance with Reporting and Planning Requirements Please provide dates for all reports and plans due during the reporting period. An explanation is required in relation to any reports or plans not provided to the Director by the due date. 1. Compliance with Reporting and Planning Requirements Title of Report / Plan Due date Comments Click here to enter text. Click here to enter a date. Click here to enter text. Click here to enter text. Click here to enter a date. Click here to enter text. Click here to enter text. Click here to enter a date. Click here to enter text. Click here to enter text. Click here to enter a date. Click here to enter text. D4 Summary of Compliance with Permit Conditions 1. Were all environmental conditions of Permit/EPN fully complied with in the reporting period (including monitoring and reporting requirements, but excluding discharge limit compliance?) Yes or No If you answered ‘No’ to question 1 above, please supply details of each non-compliance using the table below. Please use a separate template for each non-compliance and note the number of additional templates that have been used. 2. Details of non compliance Condition of Permit/EPN not complied with Click here to enter text. Version 7, June 2013 Annual Environmental Review - Page 24 Department of Primary Industries, Parks, Water and Environment Summary of particulars of non-compliance (provide cross-reference to other sections of this report if relevant) Click here to enter text. Date/time of events when the non-compliance occurred (if multiple occurrences, list each separately) Click here to enter text. If relevant, the exact location of the non-compliance Click here to enter text. Cause of non-compliance Click here to enter text. Reference to existing contingency/management plan and how this was implemented Click here to enter text. Action taken or that will be taken to mitigate any adverse effects of the noncompliance Click here to enter text. Results of any samples taken in relation to the non-compliance event or investigation into environmental impact of non-compliance Click here to enter text. Action taken to prevent a reoccurrence of non-compliance (including timeframes) Click here to enter text. Version 7, June 2013 Annual Environmental Review - Page 25 Department of Primary Industries, Parks, Water and Environment D5 Reuse annual reporting 1. Have you submitted your annual reporting for reuse where required? Yes or No Version 7, June 2013 Annual Environmental Review - Page 26 Department of Primary Industries, Parks, Water and Environment Section E: Incidents and Complaints E1 Notifiable Incidents under section 32, EMPCA 1. In the table below, provide summary information regarding incidents notifiable under section 32 of EMPCA for the reporting period excluding bypass events. Incident category Number of incidents Noise Click here to enter text. Odour Click here to enter text. Other (eg. chemical spills) Click here to enter text. TOTAL Click here to enter text. 2. Broadly characterise the notifiable incidents and provide information on what actions have been or will be taken to prevent reoccurrence of similar incidents in the future. Click here to enter text. Version 7, June 2013 Annual Environmental Review - Page 27 Department of Primary Industries, Parks, Water and Environment 3. Provide information on bypass events during the reporting period. Please note that “bypass” means the discharge of untreated or partially treated effluent most commonly as a result of wastewater treatment plant (WWTP) component failure or increased inflows to the WWTP as a result of high rainfall. Easting (GDA94) Northing (GDA94) eg. 526428 mE eg. 5252095 mS Enter text Enter text Enter text Enter text Discharge location name Event date Volume discharged Volume estimated or measured Level of treatment Enter text Enter text Enter text Enter text Enter text Enter text Enter text Enter text Enter text Enter text Enter text Enter text Enter text Enter text Enter text Enter text Enter text 4. Total number of bypass events in the reporting period: Enter text 5. Provide information on what actions have or will been taken to prevent reoccurrence of bypass events: Click here to enter text. 6. Provide total number of notifiable incidents in the reporting period (totals from E1.1 and E1.4): Enter text Version 7, June 2013 Annual Environmental Review - Page 28 Department of Primary Industries, Parks, Water and Environment E2 Complaints against the Activity Note: Complainants’ personal details must be removed as required under the Personal Information Protection Act 1994 1. Provide the number of complaints by category received from the public during the reporting period. Note that some complaints may be notifiable incidents under section 32 of EMPCA. Therefore, there may be some duplication with this section and section E1. Complaint category Number Noise Click here to enter text. Odour Click here to enter text. Other Click here to enter text. TOTAL Click here to enter text. 2. Broadly characterise the complaints and provide information on what actions have been or will be taken to address the cause of the complaints. Click here to enter text. Version 7, June 2013 Annual Environmental Review - Page 29 Department of Primary Industries, Parks, Water and Environment Section F: Additional Commitments F1 Review of Development Proposal and Environmental Management Plan (DPEMP) & Environmental Management Plan (EMP) Provide the following information: 1. List any relevant EMP, DPEMP and Reuse EMP and agreed review dates. Title Date Agreed Review Date Click here to enter text. Date Click here to enter text. Click here to enter text. Date Click here to enter text. Click here to enter text. Date Click here to enter text. Version 7, June 2013 Annual Environmental Review - Page 30 Department of Primary Industries, Parks, Water and Environment Appendix 1: Calculation of Mass Loads General Actual loads of air and water pollutants emitted over a given time period can be determined by monitoring the volume of emissions/discharge over that time period and the pollutant concentration (pollutant mass per unit volume) in the emission / discharge: Pollutant load = pollutant concentration x volume Volume normally needs to be measured continuously, and flow-weighted composite sampling is the ‘best practice’ expectation in relation to flow monitoring for most Tasmanian WWTP. In the case of sewage lagoons, however, grab sampling is considered appropriate as effluent quality should be relatively consistent throughout the lagoon. Pollutant concentration, provided that it does not vary widely, can be established via a statistically rigorous sampling regime. Monitoring of discharge concentration Effluent sampling must be undertaken in accordance with the environmental conditions of the permit. Depending on the type of wastewater treatment system and the date of issue of the environmental conditions, the specified method may be composite sampling (time- or flow-weighted) or grab sampling. Flow monitoring For the purpose of mass load calculation, outflow measurement is the preferred method for monitoring flow. However, if outflow volumes are not measured and this measurement is not required under the environmental conditions of the permit, inflow data may be used. In this case, evaporation losses must be measured or estimated and deducted from the inflow data in accordance with the following calculation: Estimated discharge = inflow – sum of [(evaporation – rainfall) x pond or lagoon surface area] Calculating actual pollutant loads discharged to waters On the basis of the concentration results for the two parameters of concern, Total Nitrogen and Total Phosphorus, and volume data in relation to the discharge of effluent to waters, use the steps below to calculate the actual load of the pollutant discharged. Choose the method which is consistent with the sampling technique utilised. Please note that missing sampling results affect the statistical accuracy of the calculations. If the number of sampling results available for a parameter is less than 50% of results required, the results are not considered relevant. 1. Time-weighted composite or grab sampling Step 1: Calculate the observed load on each day a pollutant concentration sample is collected: Version 7, June 2013 Annual Environmental Review - Page 31 Department of Primary Industries, Parks, Water and Environment Ld = Cd x Vd / 1000 Where Ld = day’s observed load of the pollutant (kg) Cd = concentration of the pollutant on the day (mg/L) Vd = day’s total volume of discharge (kL) Step 2: Sum the observed daily loads (kg). Step 3: Divide the total from Step 2 by the total volume (kL) for those days. The result is the flowweighted concentration (kg/kL). Step 4: Multiply the flow-weighted concentration (kg/kL) from Step 3 by the total volume of treated effluent discharged during the reporting period (kL). Repeat the procedure for each pollutant in relation to a mass load limit is specified in the environmental conditions. 2. Flow-weighted composite sampling Step 1: Calculate the observed load on each day a pollutant concentration sample is collected: Ld = Cd x Vd / 1000 Where Ld = day’s observed load of the pollutant (kg) Cd = concentration of the pollutant on the day (mg/L) Vd = day’s total volume of discharge (kL) Step 2: Sum the observed daily loads (kg). Step 3: Divide the total from Step 2 by the number of sampling events and multiply by 365. This will provide the annual pollutant load in kg. Step 4: Repeat the procedure for each pollutant in relation to a mass load limit is specified in the environmental conditions. Version 7, June 2013
