math/VAAP Mathematics Resources High School
advertisement
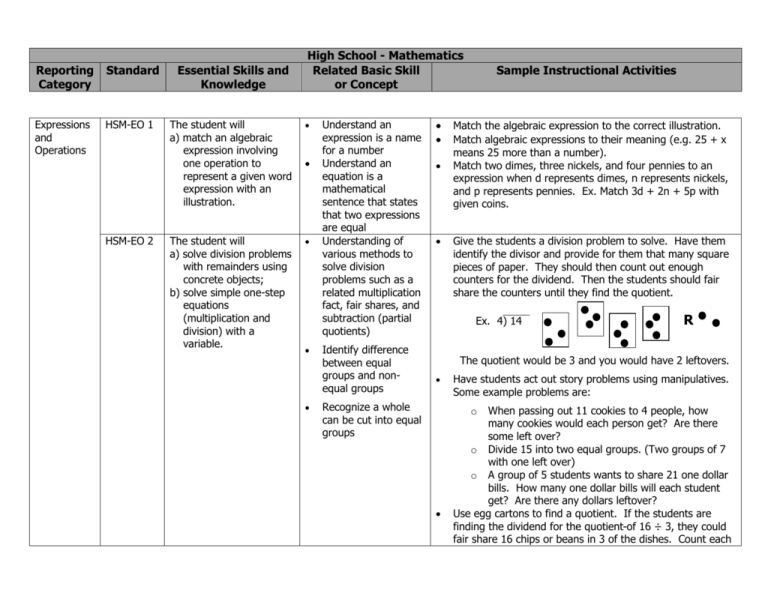
Reporting Category Standard Expressions and Operations HSM-EO 1 HSM-EO 2 Essential Skills and Knowledge High School - Mathematics Related Basic Skill or Concept The student will a) match an algebraic expression involving one operation to represent a given word expression with an illustration. The student will a) solve division problems with remainders using concrete objects; b) solve simple one-step equations (multiplication and division) with a variable. Understand an expression is a name for a number Understand an equation is a mathematical sentence that states that two expressions are equal Understanding of various methods to solve division problems such as a related multiplication fact, fair shares, and subtraction (partial quotients) Identify difference between equal groups and nonequal groups Sample Instructional Activities Match the algebraic expression to the correct illustration. Match algebraic expressions to their meaning (e.g. 25 + x means 25 more than a number). Match two dimes, three nickels, and four pennies to an expression when d represents dimes, n represents nickels, and p represents pennies. Ex. Match 3d + 2n + 5p with given coins. Give the students a division problem to solve. Have them identify the divisor and provide for them that many square pieces of paper. They should then count out enough counters for the dividend. Then the students should fair share the counters until they find the quotient. Ex. 4) 14 R The quotient would be 3 and you would have 2 leftovers. Recognize a whole can be cut into equal groups Have students act out story problems using manipulatives. Some example problems are: When passing out 11 cookies to 4 people, how many cookies would each person get? Are there some left over? o Divide 15 into two equal groups. (Two groups of 7 with one left over) o A group of 5 students wants to share 21 one dollar bills. How many one dollar bills will each student get? Are there any dollars leftover? Use egg cartons to find a quotient. If the students are finding the dividend for the quotient of 16 ÷ 3, they could fair share 16 chips or beans in 3 of the dishes. Count each o Reporting Category Standard Essential Skills and Knowledge High School - Mathematics Related Basic Skill or Concept Equations and Inequalities HSM-EI 1 HSM-EI 2 HSM-EI 3 The student will a) solve an algebraic expression using subtraction. The student will a) solve one-step inequalities. The student will a) determine the two pieces of information that are plotted on a Understanding of a variable Understand the inverse operation of subtraction is addition Understanding of a variable Solving for an unknown Understanding of a variable Identify major parts of a graph Sample Instructional Activities individual dish to identify the quotient. Put any leftovers in the lid. The leftovers will be the remainder. Play a game where students solve for the unknown. They play until they get three in a row on the gameboard. Solve algebraic expressions using subtraction. Ex. Solve 30 - x, when x = 15 Ex. Solve 20 - x, When x = 7 Have students experience some story situations in which they match an algebraic expression to the story. Some example problems are:* o If I have two bills in my pocket, one of them is a $10 and one of them is unknown. What is the value of the unknown bill if I have a total of $20? o I have saved $5. I need $12 for a new video game. How much more money do I need? o I have three bills, one of them is a $5 bill and one of them is a $10 bill. If I have $16 what is the other bill I have? Show the students a one-step inequality. Give them two answer choices. Have them choose the correct answer. Give the student story problems. Have them match the one-step inequality to the problem and then solve. Ex. Max wants to buy a video game that costs $20. He has $15. How much more money does he need? Ex. Samantha has nine apples. Two of her friends are joining her for snack. Samantha wants to share her apples with her friends. Does she have enough to give each friend two apples?* Make a prediction using the graph of an equation with two variables that form a line when plotted using the trend of the line.* o Given the graph of a linear function based on real- Reporting Category Standard Essential Skills and Knowledge High School - Mathematics Related Basic Skill or Concept graph of an equation with two variables that form a line when plotted; b) interpret rate of change (e.g. higher/lower, faster/slower). Functions and Statistics HSM-FS 1 The student will a) use the concept of functions to solve problems; b) select the appropriate graphical representation (first quadrant) given a situation involving constant rate of change. Understand and identify basic information located on graphs Identify a line on a line graph Identify the highest bar on a bar graph Recognize different types of graphs Sample Instructional Activities world situations (e.g. How much money do I earn (y) if I work a given number of hours (x) at 7 dollars per hour; (y = 7 x hours). Use this information to make predictions (e.g. If you work four hours, how much will you make?).* Follow the line on the graph to tell the two pieces of information in each point (total amount made and hours worked).* Locate objects using a map with pictorial cues using two coordinates to find one position on a map.* Use the concept of functions to identify how the two variables are affected.* o Given a graph showing the growth of a plant over a period of one month, identify that, as the number of days increase, plant height increases.* o Given a graph that shows the amount of paint in can and the area painted, identify that, as the area painted increases, the amount of paint in the can decreases.* o Tell the cost of movie tickets for five people if movies tickets are $3 per ticket.* o The amount of change you get from a drink machine if each drink cost $0.65. The amount of change you receive will be a function of how much you put into the machine.* Use the concept of function to solve problems.* o Using a store scenario, one store charges students $2 more than another store for the same item. Tom purchases a caramel apple for $5. What should Becky expect to pay for an identical apple at the more expensive store?* o Look at a graph to identify relationship between two variables (distance--time, cost--product, etc.). If every item cost $1 at a store, how much would five Reporting Category Standard Essential Skills and Knowledge High School - Mathematics Related Basic Skill or Concept Sample Instructional Activities items cost?* o Determine the total distance traveled in 20 minutes using a table if you are traveling at a constant speed of one mile every 10 minutes.* HSM-FS 2 The student will a) indicate general trends on a graph or chart. Understand and identify basic information located on graphs Recognize different types of graphs HSM-FS 3 HSM-FS 4 The student will a) given data, construct a simple graph (table, line, pie, bar, or picture) and answer questions about the data. The student will a) model a simple linear function such as y=mx Understand and identify basic information located on graphs Understand how to read line graphs Plotting points using the x and y axis Match line graphs to the correct story based on the labels of the x and y axis as well as the slope of the line.* Extend a graph or chart to make a prediction.* o If the weatherman says there is a 70% chance of snow, should you wear snow boots?* o Show a graph, predict which direction the line will continue and answer predictive questions.* Use a graph and estimate a future point when the trend line is consistent.* Collect and organize data in simple graphs and use findings to draw conclusions from the data.* o Ask 10 people how long it takes them to get ready in the morning. Put the findings into a graph and tell which person gets ready the fastest and longest.* Use graphing software to build graphs.* Given data, have student construct a simple graph.* o Given the data about temperature highs in a week, place the information on a line graph and answer questions about the graph.* o Given data about students favorite football teams construct a bar or circle graph and answer questions about findings.* Plot points using pictures in first quadrant on a graph using whole numbers and explain how y increases/decreases as x changes.* Reporting Category Standard Essential Skills and Knowledge to show functions grow by equal factors over equal intervals. High School - Mathematics Related Basic Skill or Concept Sample Instructional Activities o If you go to the store where every item is one dollar, students should state y = x (the number of items I buy will tell me the cost). Students will then plot this on the graph or create a table.* x y 1 2 3 4 If I get two apples for every orange I buy, students should state that y = 2x, or for every orange I buy (x), I will get two apples (y), therefore x times two tells me the number of apples each time. Students should then plot this on the graph or create a table.* Give the students a data table and have them plot points on a graph. Have the students match the data table to the correct graph. * Sample Instructional Activities adapted from Common Core Essential Elements and Range of Complexity for High School o
