Algebra II: Modeling Real-World Data with Functions
advertisement
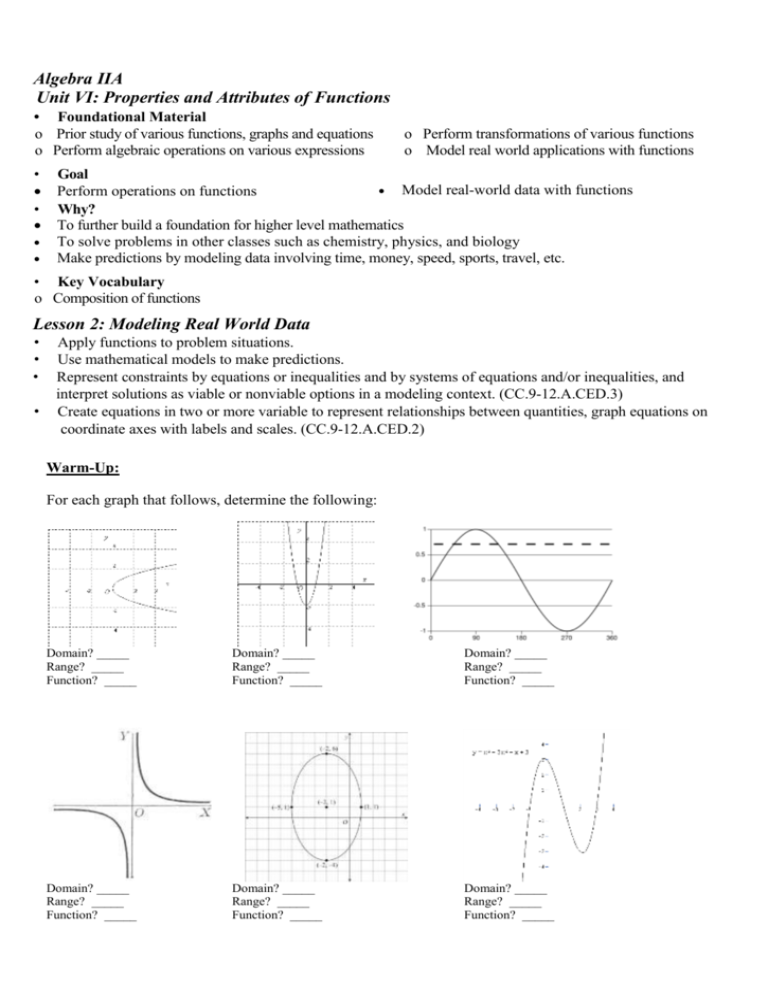
Algebra IIA Unit VI: Properties and Attributes of Functions • Foundational Material o Prior study of various functions, graphs and equations o Perform algebraic operations on various expressions • • o Perform transformations of various functions o Model real world applications with functions Goal Model real-world data with functions Perform operations on functions Why? To further build a foundation for higher level mathematics To solve problems in other classes such as chemistry, physics, and biology Make predictions by modeling data involving time, money, speed, sports, travel, etc. • Key Vocabulary o Composition of functions Lesson 2: Modeling Real World Data • • • • Apply functions to problem situations. Use mathematical models to make predictions. Represent constraints by equations or inequalities and by systems of equations and/or inequalities, and interpret solutions as viable or nonviable options in a modeling context. (CC.9-12.A.CED.3) Create equations in two or more variable to represent relationships between quantities, graph equations on coordinate axes with labels and scales. (CC.9-12.A.CED.2) Warm-Up: For each graph that follows, determine the following: Domain? _____ Range? _____ Function? _____ Domain? _____ Range? _____ Function? _____ Domain? _____ Range? _____ Function? _____ Domain? _____ Range? _____ Function? _____ Domain? _____ Range? _____ Function? _____ Domain? _____ Range? _____ Function? _____ Graphs of Functions You Should Know Linear Function Quadratic Function Parent Function: ________ Parent Function: ________ Parent Function: ________ Domain? ______________ Domain? ___________________ Domain? ___________________ Range? _______________ Range? ____________________ Range? ____________________ End –Behavior? _________ End –Behavior? ______________ End –Behavior? ______________ Asymptotes? ____________ Asymptotes? _________________ Asymptotes? ________________ Square Root Function Absolute Value Function Cubic Function Rational Function Parent Function: ________ Parent Function: ________ Parent Function: ________ Domain? ______________ Domain? ___________________ Domain? ___________________ Range? _______________ Range? ____________________ Range? ____________________ End –Behavior? _________ End –Behavior? ______________ End –Behavior? ______________ Asymptotes? ____________ Asymptotes? _________________ Asymptotes? ________________ Logarithmic Function Exponential Function Parent Function: ________ Parent Function: ________ Parent Function: ________ Domain? ______________ Domain? ___________________ Domain? ___________________ Range? _______________ Range? ____________________ Range? ____________________ End –Behavior? _________ End –Behavior? ______________ End –Behavior? ______________ Asymptotes? ____________ Asymptotes? _________________ Asymptotes? ________________ Functions and Regression Linear Function Quadratic Function Square Root Function values. Square root: Constant second differences between x-values for evenly spaced y-values. Linear: Constant first difference between the y-values for evenly spaced xvalues. Quadratic: Constant second difference between the y-values for evenly spaced x- Exponential Function Exponential: Constant rations between y-values for evenly spaced xvalues. IF: x-values are evenly spaced and first differences of y-values are constant, a linear model fits the data. x 1 2 3 4 5 y 12 27 42 57 72 First differences: 15 15 15 Linear model: first differences are constant. 15 x-values are evenly spaced and second differences of y-values are constant, a quadratic model is used. x 4 5 6 7 8 y 9 15 23 33 45 First differences: 6 8 Second differences: 2 10 12 2 If first differences are not constant, try second differences. 2 x-values are evenly spaced and ratios of y-values are constant, an exponential model is used. x 10 11 12 13 y 40 100 250 625 First differences: 60 Second differences: 150 90 225 100 2.5 40 Ratios: If first and second differences are not constant, try ratios of y-values. 375 250 2.5 100 625 2.5 250 y-values are evenly spaced & second differences of x-values are constant, a square root model is used. x 42 45 52 63 78 y 3 4 5 6 7 First differences: Second differences: 3 7 4 11 4 15 4 For evenly spaced y-values, try first differences of x-values. Modeling Real-World Data Determine which parent function would best model the given data set. Choose among linear, quadratic, exponential, and square root. 1. x y 5 1 8 2 13 3 20 4 29 5 40 6 a. Look at the table at right. Are the data for one variable evenly spaced? ____________________________________ b. Look at the data for the other variable. Which differences, if any, are constant? ____________________________________ c. Which parent function best models the data? ____________________________________ 2. 3. 4. x y 26 1 2 16 2 2 4 52 24 22 3 8 8 24 32 46 4 16 10 12 40 70 5 32 12 56 6 64 x y 84 8 4 72 6 x y 2 ________________________ ________________________ ________________________ Write a function that models the given data. 5. Use a graphing calculator to make a scatter plot. Then use the regression feature to find the function that best represents the data. x 2 0 2 4 6 y 8 10 8 2 8 _______________________________________ Solve. 6. The table shows the number of sport utility vehicles sold in the United States from 1997 to 2003. Write a function that models the data. Years after 1996 1 2 3 4 5 6 7 SUVs (millions) 2.3 2.8 3.1 3.2 3.8 4.0 4.3 ________________________________________________________________________________________ Original content Copyright © by Holt McDougal. Additions and changes to the original content are the responsibility of the instructor. Holt McDougal Algebra 2 Modeling Real-World Data Use constant differences or ratios to determine which parent function would best model the given data set. 1. x 12 16 20 24 28 y 0.8 3.6 16.2 72.9 328.05 2. ________________________________________ x 13 19 25 31 37 43 y –1 17 35 53 71 89 ________________________________________ 3. 4. x 2 7 12 17 22 x 0.10 0.37 0.82 1.45 2.26 y 100 55 40 185 380 y 0.3 0.6 0.9 1.2 1.5 ________________________________________ ________________________________________ Write a function that models the data set. 5. x 2.2 2.6 3.0 3.4 3.8 y 0.68 4.52 9.0 14.12 19.88 6. ________________________________________ 5 0 5 10 15 20 y 8 6 4 2 0 2 ________________________________________ 7. 8. x 0.3 0.7 1.1 1.5 1.9 x 0.06 0.375 0.96 1.815 2.94 y 2.5 3 3.6 4.32 5.184 y 0.2 0.5 0.8 1.1 1.4 ________________________________________ 9. x x 6 1 8 15 22 y 15 1 30.12 102.36 217.72 ________________________________________ 10. ________________________________________ x 0.32 2.07 4.8 8.51 13.2 y 0.9 1.6 2.3 3.0 3.7 ________________________________________ Solve. 11. The table shows the population growth of a small town. Years after 1974 Population 1 6 11 16 21 26 31 662 740 825 908 1003 1095 1200 a. Write a function that models the data. ____________________________ b. Use your model to predict the population in 2020. Original content Copyright © by Holt McDougal. Additions and changes to the original content are the responsibility of the instructor. Holt McDougal Algebra 2 You try: 1) A printing company prints advertising flyers and tracks its profits. Write a function that models the given data. 2) Flyers Printed 100 200 300 400 500 600 Profit ($) 10 70 175 312 500 720 Write a function that models the given data. x 12 14 16 18 20 22 24 y 110 141 176 215 258 305 356 3) The data shows the population of a small town since 1990. Using 1990 as a reference year, write a function that models the data. 4) Year 1990 1993 1997 2000 2002 2005 2006 Population 400 490 642 787 901 1104 1181 Write a function that models the data. b) Fertilizer/Acre (lb) 11 14 25 31 40 50 Yield/Acre (bushels) 245 302 480 557 645 705 What will the yield be if the amount of fertilizer/acre is 20 lbs? Original content Copyright © by Holt McDougal. Additions and changes to the original content are the responsibility of the instructor. Holt McDougal Algebra 2 Original content Copyright © by Holt McDougal. Additions and changes to the original content are the responsibility of the instructor. Holt McDougal Algebra 2
