Probability Instructional Slides
advertisement
Probability Unit
Definitions:
Probability: The chance or liklihood of an event occuring written as a number between 0
and 1, where no chance of something occuring has a probability of 0 and an event that
will absolutely occur is given a value of 1.
Frequency: The number of times a particular outcome is observed.
Relative Frequency: is the frequency of an outcome expressed as a fraction or
percentage of the total number of trials (probability).
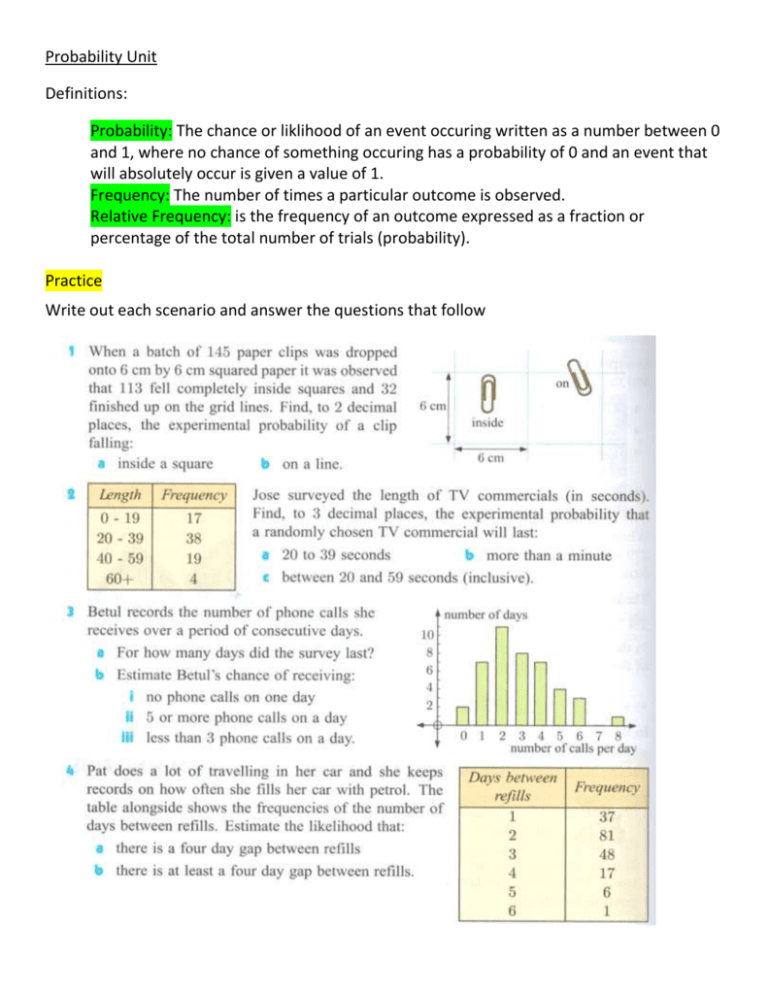
Practice
Write out each scenario and answer the questions that follow
Probabilities from Data Tables
Example
Practice
Write out each scenario and answer the questions that follow
Sample Space
Sample Space: is the set of all possible outcomes of an experiment. It is also referred to as the
universal set U.
There are 4 major methods to illustrate sample spaces, they are:
(I) Lists
(II) 2-dimensional grids
(Lattice Diagrams)
(III) tree diagrams
(IV) Venn Diagrams (They're Back!)
Examples:
(1.) List the sample space for:
(a) Tossing a Coin
(b) rolling a die
(2.) Illustrate the possible outcomes when 2 coins are tossed by using a 2-dimensional grid.
(3.) Illustrate, using a tree diagram, the possible outcomes when:
(a) Tossing 2 coins
(b) Drawing 3 marbles from a bag containing many red and yellow marbles
SEE HIM FOR EXPLANATIONS------------------------------------------------------------------------------------->
Theoretical Probability: Is the chance of an event occurring in any trial of the experiment. In
other words, the chance of something happening in an experiment before the experiment is
carried out.
Experimental Probability: is the relative frequency of an event after we recorded what
happened in the experiment.
Example:
An ordinary 6-sided die is rolled once. Determine the chance of:
(a.) getting a 6
(b) not getting 6
(c) getting 1 or 2
(d) not getting 1 or 2
Complementary Events: 2 events are complementary if exactly one of the events must occur.
If A is an event, then 𝐴′ is the complementary event of A, or "not A" So
𝑃(𝐴) + 𝑃(𝐴′ ) = 1 𝑜𝑟
Practice
𝑃(𝐴′ ) = 1 − 𝑃(𝐴)
TWO-DIMENSIONAL GRIDS
Since 2-dimensional grids give us an excellent display of entire sample spaces, we can use
them to calculate probabilities.
Example1:
Use a 2-dimensional grid to illustrate the sample space for tossing a coin and rolling a die
simultaneously. From this grid determine the probability of:
(a) tossing a head
(b) getting a tail and a 5
(c.) Getting a tail or a 5
Example2:
2 square spinners, each with 1, 2, 3 and 4 on their edges, are twirled simultaneously. Draw a 2
dimensional grid of the possible outcomes. Use your grid to determine the probability of
getting:
(a) a 3 with each spinner
Practice
(b) a 3 and a 1
(c) an even number with each spinner
Table of Outcomes
In many games, players are required to roll 2 dice simultaneously. The results are added
together to determine any number of different outcomes (e.g. squares you move).
We can use a 2-dimensional grid to represent the sum of the 2 dice being rolled. This is called
a Table of Outcomes.
Example
Draw a table of outcomes to display the possible results when 2 dice are rolled and the scores
are added together. Find the probability of getting a sum that is:
(a) equal to 7
(b) greater than 9
(c) Even
(d) at least 6
Practice
(1)
(a) Draw a table of outcomes to display the possible results when 2 dice are rolled, and the
smaller number is subtracted from the larger number.
(b) Find the probability that the resulting value is:
(i) 0
(ii) 2
(iii) greater than 3
(2) Suppose 2 spinners are spun together. 1 spinner has the outcomes 1,2,3 while the other
has 1,2,3,4,5.
(a) Draw a table of outcomes to display the possible results if the scores are multiplied.
(b) Determine the probability that the result is
(i) 6
(ii) less than 5
(iii) odd
(iv) prime
Independent Events
Example
Box X Has 2 blue and 2 green balls. Box Y has 1 white and 3 red balls. A ball is randomly
selected from each of the boxes. Determine the probability of getting a blue ball from x and
red from Y.
DEPENDENT EVENTS
Bell-Ringer (Complete Immediately)
Suppose a hat contains 5 red and 3 blue tickets. One ticket is randomly chosen, then put
aside. A second ticket is then chosen. Find the probability that
(a) The first ticket is red
(b) The first ticket is blue
(c) The second ticket is red
What are Dependent Events? 2 events are said to be dependent if the occurrence of one of
the events does affect the occurance of the other. Mathematically we write:
IF A and B are dependent events, then
𝑃(𝐴 𝑡ℎ𝑒𝑛 𝐵) = 𝑃(𝐴) ∗ 𝑃(𝐵 𝑔𝑖𝑣𝑒𝑛, 𝑡ℎ𝑎𝑡 𝐴 ℎ𝑎𝑠 𝑜𝑐𝑐𝑢𝑟𝑟𝑒𝑑)
Example1
A box contains 4 red and 2 yellow tickets. Two tickets are randomly selected from the box one
by one without replacement. Find the probability that:
(a) Both are red
(b) The first is Red and second is yellow
THIS GUY HAS EXPLANATIONS
Example2
A hat contains tickets with the numbers 1, 2, 3..., 18, 19, 20 printed on them. If 3 tickets are
drawn from the hat, without replacement, determine the probability that all are prime
numbers.
THIS GUY HAS EXPLANATIONS
Practice
Write out each problem and answer all questions.
PROBABILITIES USING TREE DIAGRAMS
Example1
Consider 2 archers firing simultaneously at a target. Li’s probability of hitting the target is
4
3
4
and Yuka has chance of hitting the target as well. Create a tree diagram that represents the
5
chance of hitting or missing a target when looking at Li and Yuka.
(a) Find the probability of each pair of possible events occurring.
THIS GUY HAS EXPLANATIONS
Practice Problems: Write out the whole problem then answer the questions that follow.
(1) Carl is not having much luck lately, His car will only start 80% of the time and his
motorbike will only start 60% of the time.
(a) Draw a tree diagram to illustrate this situation.
(b) Use the tree diagram to determine the change that:
(i) Both will start
(ii) Carl can only use his car.
(2) Two boxes each contain 6 petunia plants that are not yet flowering. Box A contains 2
plants that will have purple flowers and 4 plants that will have white flowers. Box B
contains 5 plants that will have purple flowers and 1 plant that will have white flowers.
A box is selected by tossing a coin, and one plant is removed at random from it.
Determine the probability that it will have purple flowers.
THIS GUY HAS EXPLANATIONS
More Practice
8 Three bags contain different numbers of red and blue marbles. A bag is selected
Using a die which has three A faces, two B faces, and one C face. Each bag contains
Bag A 3 Red 2 Blue
Bag B 4 Red 1 Blue
Bag C 2 Red 3 Blue
One marble is then selected randomly from the bag. Determine the probability of
a.) That the marble is blue
b.) That the marble is red
Sampling
The process of sampling is when we select one of the objects at random and inspect it for
particular features.
If the object is put back in the group before another is chosen, we call it sampling with
replacement.
If the object is put to one side, we call it sampling without replacement.
We will be using sampling along with tree diagrams.
Example
A bag contains 5 red and 3 blue marbles. Two marbles are drawn simultaneously from a bag.
Using a tree diagram determine the probability that at least one is red.
Example
A box contains 3 red, 2 blue, and 1 yellow marble. Two marbles will be taken from the box
one at a time. Construct a tree diagram to find the probability of getting 2 different colors:
a.) if replacement occurs
b.) if replacement does not occur
Practice
Write out each problem and answer all parts to each question
PROBABILITIES FROM VENN DIAGRAMS
Venn diagrams are useful in representing events in a sample space. They can even be used to
represent an event like rolling a die.
Example:
6
4
3
1
5
A
-Universal Set = 𝑈 = {1, 2, 3,4,5,6}
-The event A is rolling less than 3.
-We can write it as A = {1, 2}
2
4
-𝑃(𝐴) = and 𝑃(𝐴′ ) =
6
2
6
Although simplistic in nature, this demonstrates how we can take events that incorporate
probability and create Venn diagrams from them. Set notation is also used to express the
probabilities involved in a Venn diagram as shown above. More complicated situations can
expressed through Venn Diagrams.
Example
In a class of 30 students, 19 study Physics, 17 study Chemistry, and 15 study both of these
subjects. Display this information on a Venn diagram and then determine the probability that
a randomly selected class member studies:
(a) Both subjects
(b) at least one of the subjects
(d) Exactly one of the subjects
(e) neither subject
(f) Chemistry if it is known that the student studies Physics.
ANSWERS
(c) Physics but not Chemistry
Practice
Write out each problem and answer all parts to each question

