Unit 7 Functions and Their Graphs
advertisement
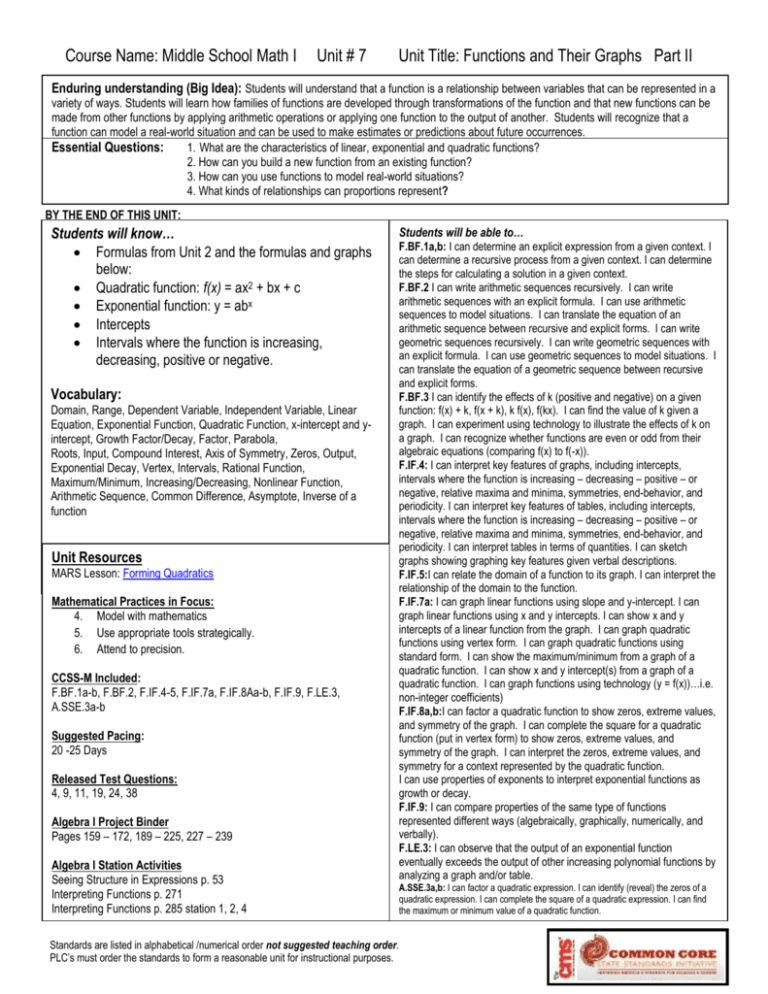
Course Name: Middle School Math I Unit # 7 Unit Title: Functions and Their Graphs Part II Enduring understanding (Big Idea): Students will understand that a function is a relationship between variables that can be represented in a variety of ways. Students will learn how families of functions are developed through transformations of the function and that new functions can be made from other functions by applying arithmetic operations or applying one function to the output of another. Students will recognize that a function can model a real-world situation and can be used to make estimates or predictions about future occurrences. Essential Questions: 1. What are the characteristics of linear, exponential and quadratic functions? 2. How can you build a new function from an existing function? 3. How can you use functions to model real-world situations? 4. What kinds of relationships can proportions represent? BY THE END OF THIS UNIT: Students will know… Formulas from Unit 2 and the formulas and graphs below: Quadratic function: f(x) = ax2 + bx + c Exponential function: y = abx Intercepts Intervals where the function is increasing, decreasing, positive or negative. Vocabulary: Domain, Range, Dependent Variable, Independent Variable, Linear Equation, Exponential Function, Quadratic Function, x-intercept and yintercept, Growth Factor/Decay, Factor, Parabola, Roots, Input, Compound Interest, Axis of Symmetry, Zeros, Output, Exponential Decay, Vertex, Intervals, Rational Function, Maximum/Minimum, Increasing/Decreasing, Nonlinear Function, Arithmetic Sequence, Common Difference, Asymptote, Inverse of a function Unit Resources MARS Lesson: Forming Quadratics Mathematical Practices in Focus: 4. Model with mathematics 5. Use appropriate tools strategically. 6. Attend to precision. CCSS-M Included: F.BF.1a-b, F.BF.2, F.IF.4-5, F.IF.7a, F.IF.8Aa-b, F.IF.9, F.LE.3, A.SSE.3a-b Suggested Pacing: 20 -25 Days Released Test Questions: 4, 9, 11, 19, 24, 38 Algebra I Project Binder Pages 159 – 172, 189 – 225, 227 – 239 Algebra I Station Activities Seeing Structure in Expressions p. 53 Interpreting Functions p. 271 Interpreting Functions p. 285 station 1, 2, 4 Students will be able to… F.BF.1a,b: I can determine an explicit expression from a given context. I can determine a recursive process from a given context. I can determine the steps for calculating a solution in a given context. F.BF.2 I can write arithmetic sequences recursively. I can write arithmetic sequences with an explicit formula. I can use arithmetic sequences to model situations. I can translate the equation of an arithmetic sequence between recursive and explicit forms. I can write geometric sequences recursively. I can write geometric sequences with an explicit formula. I can use geometric sequences to model situations. I can translate the equation of a geometric sequence between recursive and explicit forms. F.BF.3 I can identify the effects of k (positive and negative) on a given function: f(x) + k, f(x + k), k f(x), f(kx). I can find the value of k given a graph. I can experiment using technology to illustrate the effects of k on a graph. I can recognize whether functions are even or odd from their algebraic equations (comparing f(x) to f(-x)). F.IF.4: I can interpret key features of graphs, including intercepts, intervals where the function is increasing – decreasing – positive – or negative, relative maxima and minima, symmetries, end-behavior, and periodicity. I can interpret key features of tables, including intercepts, intervals where the function is increasing – decreasing – positive – or negative, relative maxima and minima, symmetries, end-behavior, and periodicity. I can interpret tables in terms of quantities. I can sketch graphs showing graphing key features given verbal descriptions. F.IF.5:I can relate the domain of a function to its graph. I can interpret the relationship of the domain to the function. F.IF.7a: I can graph linear functions using slope and y-intercept. I can graph linear functions using x and y intercepts. I can show x and y intercepts of a linear function from the graph. I can graph quadratic functions using vertex form. I can graph quadratic functions using standard form. I can show the maximum/minimum from a graph of a quadratic function. I can show x and y intercept(s) from a graph of a quadratic function. I can graph functions using technology (y = f(x))…i.e. non-integer coefficients) F.IF.8a,b:I can factor a quadratic function to show zeros, extreme values, and symmetry of the graph. I can complete the square for a quadratic function (put in vertex form) to show zeros, extreme values, and symmetry of the graph. I can interpret the zeros, extreme values, and symmetry for a context represented by the quadratic function. I can use properties of exponents to interpret exponential functions as growth or decay. F.IF.9: I can compare properties of the same type of functions represented different ways (algebraically, graphically, numerically, and verbally). F.LE.3: I can observe that the output of an exponential function eventually exceeds the output of other increasing polynomial functions by analyzing a graph and/or table. A.SSE.3a,b: I can factor a quadratic expression. I can identify (reveal) the zeros of a quadratic expression. I can complete the square of a quadratic expression. I can find the maximum or minimum value of a quadratic function. Standards are listed in alphabetical /numerical order not suggested teaching order. PLC’s must order the standards to form a reasonable unit for instructional purposes. Course Name: Middle School Math I Unit # 7 Unit Title: Functions and Their Graphs Part II CORE CONTENT Cluster Title: Build a function that models a relationship between two quantities Standard: F.BF.1: Write a function that describes a relationship between two quantities. a. Determine an explicit expression, a recursive process, or steps for calculation from a context b. Combine standard function types using arithmetic operations. For example, build a function that models the temperature of a cooling body by adding a constant function to a decaying exponential, and relate these functions to the model. Concepts and Skills to Master: Given a linear or exponential context, find an expression, recursive process, or steps to model a context with mathematical representations. Combine linear and/or exponential functions using addition, subtraction, multiplication, and division. SUPPORTS FOR TEACHERS Critical Background Knowledge Simplifying expressions Academic Vocabulary Function, intercepts, explicit expression, recursive Suggested Instructional Strategies: Toothpick patterns Give examples and use arithmetic operations to linear and exponential functions to fit the data Resources: NCDPI Unpacking: F.BF.1a: Recognize when a relationship exists between two quantities and write a function to describe them. Use steps, the recursive process, to make the calculations from context in order to write the explicit expression that represents the relationship. F.BF.1b: Students should take standard function types such as constant, linear and exponential functions and add, subtract, multiply and divide them. Also explain how the function is effected and how it relates to the model. At this level, limit to addition or subtraction of a constant function to linear, exponential, or quadratic functions or addition of linear functions to linear or quadratic functions. Standards are listed in alphabetical /numerical order not suggested teaching order. PLC’s must order the standards to form a reasonable unit for instructional purposes. Textbook Correlation: 5-4, 5-5, CC-2, CC-10, CC-17 MARS Problem Solving Lesson: Generalizing Patterns: Table Tiles MARS Apprentice Tasks: Patchwork Sidewalk Patterns MARS Expert Task: Sidewalk Stones Course Name: Middle School Math I Unit # 7 Sample Assessment Tasks Skill-based task 1. If f(x) = x + 4 and g(x) = 3x – 5, find (f + g)(x) Unit Title: Functions and Their Graphs Part II Problem Task 1. Find an expression, process or calculation to determine the number of squares needed to make the next three patterns in the series. 2. Anne is shopping and finds a $30 sweater on sale for 20% off. When she buys the sweater, she must also pay 6% sales tax. Write an expression for the final price of the sweater in such a way that the original price is still evident. (Extension: if the clerk just adds 14% will the price be correct?) 2. Ten bacteria are placed in a test tube and each one splits in two after one minute. After 1 minute, the resulting 10 bacteria each split in two, creating 20 bacteria. This process continues for one hour until test tube is full. a. How many bacteria are in the test tube after 5 minutes? 15 minutes? b. Describe how to take any current number of bacteria to find the number of bacteria at the next minute (this is writing a NOW NEXT rule). c. Write an equation that will determine the number of bacteria after any number of minutes. d. How many bacteria are in the test tube after one hour? e. For further research, Dr. Bland removes 5 bacteria after each minute from the original test tube to start a new cell culture. Write the resulting equation and describe how this affected your rule in parts b. and c.? 3. A single bacterium is placed in a test tube and splits in two after one minute. After two minutes, the resulting two bacteria split in two, creating four bacteria. This process continues for one hour until test tube is filled up. How many bacteria are in the test tube after 5 minutes? 15 minutes? Write a recursive rule to find the number of bacteria in the test tube after n minutes. Convert this rule into explicit form. How many bacteria are in the test tube after one hour? 4. Suppose Kevin had $10,000 to invest in a CD account paying 8% interest compounded yearly. The function representing this situation is y = 10000(1.08x). When the constant function y = 50 is added to the function, what effect does it have on the exponential function? What does that mean in the context of the problem? Standards are listed in alphabetical /numerical order not suggested teaching order. PLC’s must order the standards to form a reasonable unit for instructional purposes. Course Name: Middle School Math I Unit # 7 Unit Title: Functions and Their Graphs Part II CORE CONTENT Cluster Title: Build a function that models a relationship between two quantities Standard F.BF.2: Write arithmetic and geometric sequences both recursively and with an explicit formula, and use them to model situations and translate between the two forms. FOCUS IS EXPONENTIAL FUNCTIONS Concepts and Skills to Master: Write arithmetic sequences both recursively and with an explicit formula, use the two forms to model a situation and translate between the two forms. Write geometric sequences both recursively and with an explicit formula, use the two forms to model a situation and translate between the two forms. Understand that linear functions are the explicit form of recursively-defined arithmetic sequences and that exponential functions are the explicit form of recursively-defined geometric sequences. SUPPORTS FOR TEACHERS Critical Background Knowledge Identify arithmetic and geometric sequences Academic Vocabulary Arithmetic sequence, geometric sequence, recursive, explicit, NOW/NEXT EQUATIONS Suggested Instructional Strategies: Resources: Use tables to elicit the difference between recursive and explicit formulas for the same pattern Write recursive and explicit formulas for patterns made by adding toothpicks to existing patterns. Match sequences expressed recursively with those expressed explicitly NCDPI Unpacking: F-BF.2: Use arithmetic, common difference, and geometric, common ratio, sequences to model real-life situations. Write both the recursive and exact rule for each type of sequence, and translate from one form of the sequence to the other. Write the recursive and explicit forms of the arithmetic and geometric sequences. Translate between the recursive and explicit forms. Use the recursive and explicit forms of arithmetic and geometric sequences to model real-world situations. In an arithmetic sequence, each term is obtained from the previous term by adding the same number each time. This number is called the common difference. In a geometric sequence, each term is obtained from the previous term by multiplying by a constant amount, called the common ratio. Connect arithmetic sequences to linear functions and geometric sequences to exponential functions. At this level, formal recursive notation is not used. Instead, use of informal recursive notation (such as NEXT = NOW + 5, starting at 3) is intended. Standards are listed in alphabetical /numerical order not suggested teaching order. PLC’s must order the standards to form a reasonable unit for instructional purposes. Textbook Correlation: CC-2, CC-10 MARS Problem Solving Lesson: Generalizing Patterns: Table Tiles MARS Apprentice Tasks: Patchwork Sidewalk Patterns MARS Expert Task: Sidewalk Stones Course Name: Middle School Math I Sample Assessment Tasks Skill-based task Write two formulas that model the pattern: 3, 9, 27, 81… Unit # 7 Unit Title: Functions and Their Graphs Part II Problem Task The diagram below represents a famous mathematical fractal called Koch’s Curve. Each new stage is formed by replacing the middle of each line segment with a “tent” shape, creating additional line segments as shown below. This process continues indefinitely! a. Create a sketch of stage 3. b. Record the number of resulting line segments in the table below. c. Write a rule that shows how the number of line segments for the next step depends on the prior number of line segments (Hint: think NOW- NEXT) d. Write a rule to determine the number of line segments at any stage. e. Compare the rules you developed in parts (c) and (d). Write an explanation as to what characteristics of the sequence can be seen when using each form? Also include the pros and cons when using each of the forms. Standards are listed in alphabetical /numerical order not suggested teaching order. PLC’s must order the standards to form a reasonable unit for instructional purposes. Course Name: Middle School Math I Unit # 7 Unit Title: Functions and Their Graphs Part II CORE CONTENT Cluster Title: Build new functions from existing functions. Standard: F.BF.3: Identify the effect on the graph of replacing f(x) by f(x) + k, kf(x), f(kx), and f(x + k) for specific values of k (both positive and negative); find the value of k given the graphs. Experiment with cases and illustrate an explanation of the effects on the graph using technology. Include recognizing even and odd functions from their graphs and algebraic expressions for them. Concepts and Skills to Master: Perform translations and transformations on quadratic and absolute value graphs Find the value of k given f(x) replaced by f(x) + k, kf(x), and f(x + k) on a graph of a quadratic or absolute value function Relate the vertical translations of a quadratic or absolute value function to its y-intercept Relate the horizontal translations of a quadratic or absolute value function to its x-intercept Relate vertical stretch (vertical shrink) to the narrowing (widening) of the graph. Describe what will happen to a function f(x) is replaced by f(x) + k, kf(x), or f(x + k) for different values of k. SUPPORTS FOR TEACHERS Critical Background Knowledge Graphing quadratic, exponential, and absolute value functions Academic Vocabulary Translation, transformation, y-intercept, x-intercept, vertical shift, horizontal shift, vertical stretch, vertical shrink Suggested Instructional Strategies: Use graphing technology to explore translations of functions Resources: Textbook Correlation: 7-7, 9-1, CB5-3, CC-4, CC-6, CC-11, CC13 NCDPI Unpacking: F.BF.3 Know that when adding a constant, k, to a function, it moves the graph of the function vertically. If k is positive, it translates the graph up, and if k is negative, it translates the graph down. If k is either added or subtracted from the x-value, it translates the graph of the function horizontally. If we add k, the graph shifts left and if we subtract k, the graph shifts right. The expression (x + k) shifts the graphs k units to the left because when x + k = 0, x = -k. Use the calculator to explore the effects these values have when applied to a function and explain why the values affect the function the way it does. The calculator visually displays the function and its translation making it simple for every student to describe and understand translations. At this level, limit to vertical and horizontal translations of linear and exponential functions. Even and odd functions are not addressed. Relate the vertical translation of a linear function to its y-intercept. Identify the effect transformations have on functions in multiple modalities or ways. Student should be fluent with representations of functions as equations, tables, graphs, and descriptions. They should also understand how each representation of a function is related to the others. For example, the equation of the line is related to it’s graph, table, and when in context, the problem being solved. Standards are listed in alphabetical /numerical order not suggested teaching order. PLC’s must order the standards to form a reasonable unit for instructional purposes. Course Name: Middle School Math I Sample Assessment Tasks Skill-based task Graph the following on a single set of axes: f(x) = x2 f(x) = x2 + 2 f(x) = (x+2)2 f(x) = 2x2 Unit # 7 Unit Title: Functions and Their Graphs Part II Problem Task 1. Compare and contrast the graph of any function f(x) with the graph of f(x) + k, f(x +k) and kf(x). 2. Given g(x) = x2 describe the changes in the graph of g(x), that occurred to create f(x) = 2(x – 5)2 + 7. 3. If f(x) represents a diver’s position from the edge of a pool as he dives from a 5ft. long board 25ft. above the water. If his second dive was from a 10ft. long board that is 10ft above the water, what happens to my equation of f(x) to model the second dive? 4. Fill in all missing components to the below table. Description of Change Original Function Output x -3 -2 -1 0 1 2 3 f(x) 9 4 1 0 1 4 9 Multiply the original function output by 5 f(x)+5 5 9 a. Graph and label each of the function outputs with the corresponding x-values on the same set of axis in three different colors. b. Explain the relationship that exists between the original function and the transformed functions. Standards are listed in alphabetical /numerical order not suggested teaching order. PLC’s must order the standards to form a reasonable unit for instructional purposes. Course Name: Middle School Math I Unit # 7 Unit Title: Functions and Their Graphs Part II CORE CONTENT Cluster Title: Interpret functions that arise in applications in terms of a context. Standard: F.IF.4: For a function that models a relationship between two quantities, interpret key features of graphs and tables in terms of the quantities, and sketch graphs showing key features given a verbal description of the relationship. Key features include: intercepts, intervals where the function is increasing, decreasing, positive, or negative; relative maximums and minimums; symmetries; end-behavior; and periodicity. Concepts and Skills to Master: Given a graph, identify key features such as x-and y-intercepts; intervals where the function is increasing, decreasing, positive or negative; maxima or minima; symmetry and end-behavior Given a table of values, identify key features such as x- and y-intercepts; intervals where the function is increasing, decreasing, positive or negative; maxima or minima; symmetry and end-behavior Find key features of a function and use them to graph the function Use interval notation and symbols of inequality to communicate key features of graphs SUPPORTS FOR TEACHERS Critical Background Knowledge Ability to graph a quadratic, absolute value or piecewise-defined function from a table or equation Academic Vocabulary Increasing, decreasing, positive, negative, intervals, intercepts, interval notation, maximum, minimum Suggested Instructional Strategies: Resources: Use graphing technology to explore and identify key features Textbook Correlation: 4-2, 4-3, 5-3, 5-4, 5-5, 7-6, of a function. 7-7, 9-1, 9-2, 9-7, 11-7 Use key features of a function to graph functions by hand NCDPI Unpacking F.IF.4: When given a table or graph of a function that models a reallife situation, explain the meaning of the characteristics of the graph in the context of the problem. The characteristics described should include rate of change, intercepts, maximums/minimums, symmetries, and intervals of increase and/or decrease. At this level, focus on linear, exponential, and quadratic functions; no end behavior or periodicity. When given a verbal description of the relationship between two quantities, sketch a graph of the relationship, showing key features. Note – This standard should be seen as related to F-IF.7 with the key difference being students can interpret from a graph or sketch graphs from a verbal description of key features. This standard should be revisited with every function your class is studying. Students should be able to move fluidly between graphs, tables, words, and symbols and understand the connections between the different representations. For example, when given a table and graph of a function that models a real-life situation, explain how the table relates to the graph and vice versa. Also explain the meaning of the characteristics of the graph and table in the context of the problem as follows: At the course one level, the focus is on linear, exponentials, and quadratics • Linear – x/y-intercepts and slope as increasing or decreasing at a constant rate. • Exponential- y-intercept and increasing at an increasing rate or decreasing at a decreasing rate. • Quadratics – x-intercepts/zeroes, y-intercepts, vertex, intervals of increase/decrease, the effects of the coefficient of x2 on the concavity of the graph, symmetry of a parabola. Standards are listed in alphabetical /numerical order not suggested teaching order. PLC’s must order the standards to form a reasonable unit for instructional purposes. Course Name: Middle School Math I Unit # 7 Unit Title: Functions and Their Graphs Part II Sample Assessment Tasks Skill-based task Identify the intervals where the function is increasing and decreasing. Problem Task 1. Create a story that would generate a quadratic, absolute value or piecewise-defined function and describe the meaning of key features of the graph as they relate to the story. 2. Below is a table that represents the relationship between daily profit, P for an amusement park and the number of paying visitors in thousands, n. a. What are the x-intercepts and y-intercepts and explain them in the context of the problem. b. Identify any maximums or minimums and explain their meaning in the context of the problem. c. Determine if the graph is symmetrical and identify which shape this pattern of change develops. d. Describe the intervals of increase and decrease and explain them in the context of the problem. 3. A rocket is launched from 180 feet above the ground at time t = 0. The function that models this situation is given by h(t) = – 16t2 + 96t + 180, where t is measured in seconds and h is height above the ground measured in feet. a. What is the practical domain for t in this context? Why? b. What is the height of the rocket two seconds after it was launched? c. What is the maximum value of the function and what does it mean in context? d. When is the rocket 100 feet above the ground? e. When is the rocket 250 feet above the ground? f. Why are there two answers to part e but only one practical answer for part d? g. What are the intercepts of this function? What do they mean in the context of this problem? h. What are the intervals of increase and decrease on the practical domain? What do they mean in the context of the problem? 4. Elizabeth and Joshua tried to get a monthly allowance from their mother. If their mother initially paid them a penny and 2 pennies for the first day of the month, 4 pennies for the second day, and so on. How much would their mother have to pay on the 10th, 20th, and 30th day of the month? Sketch the graph of the relationship between the two quantities and explain what the point (0,1) represents. Standards are listed in alphabetical /numerical order not suggested teaching order. PLC’s must order the standards to form a reasonable unit for instructional purposes. Course Name: Middle School Math I Unit # 7 Unit Title: Functions and Their Graphs Part II CORE CONTENT Cluster Title: Interpret functions that arise in applications in terms of a context. Standard F.IF.5: Relate the domain of a function to its graph and, where applicable, to the quantitative relationship it describes. For example, if the function h(n) gives the number of person-hours it takes to assemble n engines in a factory, then the positive integers would be an appropriate domain for the function. Concepts and Skills to Master: Identify domains of functions given a graph Graph a function given a restricted domain Identify reasonability of a domain in a particular context SUPPORTS FOR TEACHERS Critical Background Knowledge Familiarity with function notation and domain Knowledge of independent and dependent variables Academic Vocabulary Domain, function, integers, independent variables, dependent variable, restricted domain Suggested Instructional Strategies: Discuss contexts where the domain of a function should be limited to a subset of integers, positive or negative values, or some other restriction to the real numbers Find examples of functions with limited domains from other curricular areas (science, physical education, social studies, consumer science…) Focus on quadratic functions and compare with linear and exponential functions studied earlier in the course. Resources: Textbook Correlation: 4-4, 7-6, 9-1, 11-6 NCDPI Unpacking F.IF.5: From a graph students will identify the domain. In context, students will identify the domain, stating any restrictions and why they are restrictions. At this level, focus on linear and exponential functions. Given a function, determine its domain. Describe the connections between the domain and the graph of the function. Know that the domain taken out of context is a theoretical domain and that the practical domain of a function is found based on a contextual situation given, and is the input values that make sense to the constraints of the problem context. Standards are listed in alphabetical /numerical order not suggested teaching order. PLC’s must order the standards to form a reasonable unit for instructional purposes. Course Name: Middle School Math I Unit # 7 Sample Assessment Tasks Skill-based task You are hoping to make a profit on the school play and have determined the function describing the profit to be f(t) = 8t – 2654 where t is the number of tickets sold. What is a reasonable domain for this function? Explain. Unit Title: Functions and Their Graphs Part II Problem Task 1. Create functions in context where the domain would be: a. All real numbers b. Integers c. Negative integers d. Rational numbers e. (10, 40) 2. If Jennifer buys a cell phone and the plan she decided upon charged her $50 for the phone and $0.10 for each minute she is on the phone. What would be the appropriate domain that describes this relationship? Describe what is meant by the point (10, 51). 3. Graph the function f(x) = 4x + 7 and determine the domain and range, identifying any restrictions on that exist. 4. A rocket is launched from 180 feet above the ground at time t = 0. The function that models this situation is given by h(t) = – 16t2 + 96t + 180, where t is measured in seconds and h is height above the ground measured in feet. a. What is the theoretical domain for the function? How do you know this? b. What is the practical domain for t in this context? Explain. c. What is the height of the rocket two seconds after it was launched? d. What is the maximum value of the function and what does it mean in context? e. When is the rocket 100 feet above the ground? f. When is the rocket 250 feet above the ground? g. Why are there two answers to part e but only one practical answer for part d? h. What are the intercepts of this function? What do they mean in the context of this problem? i. What are the intervals of increase and decrease on the practical domain? What do they mean in the context of the problem? Standards are listed in alphabetical /numerical order not suggested teaching order. PLC’s must order the standards to form a reasonable unit for instructional purposes. Course Name: Middle School Math I Unit # 7 Unit Title: Functions and Their Graphs Part II CORE CONTENT Cluster Title: : Analyze functions using different representations Standard F.IF.7: Graph functions expressed symbolically and show key features of the graph, by hand in simple cases and using technology for more complicated cases. a. Graph linear and quadratic functions and show intercepts, maxima, and minima Concepts and Skills to Master: Graph parabolas expressed in vertex form or factored form by hand. Identify intercepts, maxima, minima, end behavior, increasing/decreasing intervals, and axis of symmetry in graphs of quadratic functions SUPPORTS FOR TEACHERS Critical Background Knowledge Graph points on the coordinate plane Academic Vocabulary Quadratic, increasing, decreasing, maximum, minimum, axis of symmetry, y-intercept, x-intercept, vertex Suggested Instructional Strategies: Allow students to develop graphs from tables and use those graphs to generalize graphing strategies. Graph equations generated from real-life contexts Resources: Textbook Correlation: 9-1, 9-2, CC-6, CC-16, CB5-8, 10-5 Geogebra (free online) problem task Flying T-shirt Task NCDPI Unpacking F.IF.7a: Students should graph functions given by an equation and show characteristics such as but not limited to intercepts, maximums, minimums, and intervals of increase or decrease. Students may use calculators or a CAS for more difficult cases. This standard should be seen as related to F-IF.4 with the key difference being students can create graphs, by hand and using technology, from the symbolic function in this standard. Standards are listed in alphabetical /numerical order not suggested teaching order. PLC’s must order the standards to form a reasonable unit for instructional purposes. Course Name: Middle School Math I Unit # 7 Sample Assessment Tasks Skill-based task 1. Graph the function y = (x – 3)(x + 2), identify the axis of symmetry and the vertex. Unit Title: Functions and Their Graphs Part II Problem Task 1. The all-star kicker kicks a field goal for the team and the path of the ball is modeled by f (x) = −4.9t2 + 20t. Find the realistic maximum and minimum values for the path of the ball and describe what each means in the context of this problem. Standards are listed in alphabetical /numerical order not suggested teaching order. PLC’s must order the standards to form a reasonable unit for instructional purposes. Course Name: Middle School Math I Unit # 7 Unit Title: Functions and Their Graphs Part II CORE CONTENT Cluster Title: Analyze functions using different representations Standard F.IF.8: Write a function defined by an expression in different but equivalent forms to reveal and explain different properties of the function. a. Use the process of factoring and completing the square in a quadratic function to show zeros, extreme values, and symmetry of the graph, and interpret these in terms of a context. b. Use the properties of exponents to interpret expressions for exponential functions. For example, identify percent rate of change in functions such as y = (1.02)t; y = (0.97)t, y = (1.01)12t, y = (1.2)t/10, and classify them as representing exponential growth or decay. Concepts and Skills to Master: Factor quadratic equations and identify zeros Complete the square to show extreme values and symmetry of the graph Use properties of exponents to interpret expressions for exponential functions SUPPORTS FOR TEACHERS Critical Background Knowledge Multiplying binomials, perfect square trinomials Academic Vocabulary Factor, completing the square, quadratic, zero, extreme value (minimum, maximum), symmetry, properties of exponents, growth, decay Suggested Instructional Strategies: Resources: Have students “discover” the process of Textbook Correlation: 7-7, CC-15 completing the square by using algebra tiles (or A visual representation of completing the square blocks) Proof without words: completing the square NCDPI Unpacking F.IF.8a: Students should take a function and manipulate it in a different form so that they can show and explain special properties of the function such as; zeros, extreme values, and symmetries. Students should factor and complete the square to find special properties and interpret them in the context of the problem. Keep in mind when completing the square, the coefficient on the x2 variable must always be one and what you add in to the problem, you must also subtract from the problem. In other words, we are adding zero to the problem in order to manipulate it and get it in the form we want. Students should manipulate a quadratic function to identify its different forms (standard, factored, and vertex) so that they can show and explain special properties of the function such as; zeros, extreme values, and symmetry. Students should be able to distinguish when a particular form is more revealing of special properties given the context of the situation. Standards are listed in alphabetical /numerical order not suggested teaching order. PLC’s must order the standards to form a reasonable unit for instructional purposes. Course Name: Middle School Math I Sample Assessment Tasks Skill-based task Unit # 7 Unit Title: Functions and Their Graphs Part II Problem Task 1. The Falling Freely Skydiving Company charges a basic price of $150 per person for each jump. However, business is slow and to attract more clients, the company reduces the price of each jump by $5 for each person in the group. The larger the group, the less each person pays. a. Define variables and write an equation for the price of a single jump. b. If you and a group of your friends decided to go skydiving, what would the equation be for the total price the company charges? c. What is the total price of a jump for a group of 6 people? d. The company reports that the cost of the skydiving trip was $1000.00, How many people were on the trip? e. What limitations on group size should the skydiving company use in order to make a profit? 2. Suppose you have a rectangular flower bed whose area is 24ft2. The shortest side is (x-4)ft and the longest side is (2x)ft. Find the length of the shortest side. 3. In the cartoon, Coyote was chasing the Road Runner, seeing no easy escape, Road Runner jumped off a cliff towering above the roaring river below. Molly mathematician was observing the chase and obtained a digital picture of this fall. Using her mathematical knowledge, Molly modeled the Road Runner’s fall using several quadratic functions: h(t) = -16t2 + 32t + 48 h(t) = -16(t+ 1)(t – 3) h(t) = -16(t – 1)2 + 64 a. Does Molly have three unique equations that model the same situation? Explain. b. Explain what it means for expressions or equations to be mathematically equivalent? c. Which of the equivalent equations would be most helpful in answering each of these questions? Explain. i. What is the maximum height the Road Runner reaches and when will it occur? ii. When would the Road Runner splash into the river? iii. At what height was the Road Runner when he jumped off the cliff? 4. Stephanie is considering moving to Carmel or Lunsford. Carmel’s population curve in thousands of people in year x can be shown by the equation y = 200(1.015)x. Lunsford’s population curve in thousands of people in year x can be shown by the equation y = 60(0.998)x. a. What is the rate of change in Carmel? And what is the rate of change in Lunsford? b. Which population model represents decay and which one represents growth. Justify your answer. Standards are listed in alphabetical /numerical order not suggested teaching order. PLC’s must order the standards to form a reasonable unit for instructional purposes. Course Name: Middle School Math I Unit # 7 Unit Title: Functions and Their Graphs Part II CORE CONTENT Cluster Title: Analyze functions using different representations Standard F.IF.9: Compare properties of two functions each represented in a different way (algebraically, graphically, numerically in tables, or by verbal descriptions). For example, given a graph of one quadratic function and an algebraic expression for another, say which has the larger maximum. Concepts and Skills to Master: Compare extrema and intercepts of two quadratic functions where one is represented algebraically, graphically, numerically, in tables, or in a description and the other is modeled using a different form of representation. SUPPORTS FOR TEACHERS Critical Background Knowledge Factor quadratic expressions Academic Vocabulary Quadratic function, maximum, minimum, intercepts, vertex, axis of symmetry Suggested Instructional Strategies: Resources: Compare two functions expressed in different Textbook Correlation: CC-4, CC-11, CC-13 representations. Ask: How can you determine Geogebra (free online) whether the graph of the function will have a Graphing calculators maximum or minimum? How can you find the MARS Task: Sorting Functions vertex of a quadratic from its graph, table, algebraically? Match functions expressed using different representations that have the same properties. NCDPI Unpacking F.IF.9: Students should compare the properties of two functions represented by verbal descriptions, tables, graphs, and equations. For example, compare the growth of two linear functions, two exponential functions, or one of each. At this level, limit to linear, exponential, and quadratic functions. This standard compares different functions when they have different representations. For example, one may be represented using a graph and the other an equation. Standards are listed in alphabetical /numerical order not suggested teaching order. PLC’s must order the standards to form a reasonable unit for instructional purposes. Course Name: Middle School Math I Unit # 7 Sample Assessment Tasks Skill-based task 1. Compare the functions represented below. Which has the lowest minimum? a. f(x) = 3x2 +13x +4 b. Unit Title: Functions and Their Graphs Part II Problem Task 1. A herd of horses at Corolla Beach was first counted at 100 heads. Repopulation efforts have yielded a net growth of 16% yearly of the existing horse population. Simultaneously, biologists have recorded the sea turtle population growth in the following table: Which population is growing at a faster rate? Explain your reasoning. Standards are listed in alphabetical /numerical order not suggested teaching order. PLC’s must order the standards to form a reasonable unit for instructional purposes. Course Name: Middle School Math I Unit # 7 Unit Title: Functions and Their Graphs Part II CORE CONTENT Cluster Title: Construct and compare linear, quadratic, and exponential models and solve problems. Standard: F.LE.3: Observe, using graphs and tables, that a quantity increasing exponentially eventually exceeds a quantity increasing linearly, quadratically, or (more generally) as a polynomial function. Concepts and Skills to Master: Compare linear and exponential growth to quadratic growth. SUPPORTS FOR TEACHERS Critical Background Knowledge Identify linear, quadratic and exponential functions Graph linear, quadratic and exponential functions Rate of change Academic Vocabulary Linear, exponential, quadratic, factor, difference Suggested Instructional Strategies: This standards should be taught in conjunction with others in this cluster Resources: Textbook Correlation: 9-7, CC-14 NCDPI Unpacking F.LE.3: When students compare graphs of various functions, such as linear, exponential, quadratic, and polynomial they should see that any values that increase exponentially eventually increases or grows at a faster rate than values that increase linearly, quadratically, or any polynomial function. At this level, limit to linear, exponential, and quadratic functions; general polynomial functions are not addressed. When comparing values of various functions that increase as the x-value gets larger, the values taken on by the exponential function will eventually be greater than the values of a linear, quadratic, or polynomial function. Standards are listed in alphabetical /numerical order not suggested teaching order. PLC’s must order the standards to form a reasonable unit for instructional purposes. Course Name: Middle School Math I Unit # 7 Sample Assessment Tasks Skill-based task Let P = (0, 1) and Q = (1, 2) in the (x, y) plane. a. Show that there is a unique linear function described by the equation y = mx + b whose graph contains P and Q: find m and b. b. Show that there is a unique exponential function described by the equation y = abx whose graph contains P and Q: find a and b. c. Show that there is more than one quadratic function described by the equation y = ax2 + bx + c whose graph contains P and Q . answers: 1. y = x +1 2. y = 2x 3. answers will vary. Ex. y = x2 + 1, y = -x2 + 2x + 1 Unit Title: Functions and Their Graphs Part II Problem Task 1. Carrie and Elizabeth applied for a job at the local seafood market. Carrie asked for $2 and hour, but the boss proposed giving them $.010 for the first hour, $.020 for the second hour, $.040 for the third hour, $.080, and so on. Below is a table of the hours worked per week and the pay for each hour for each of the two pay plans. When would you want to use Carrie’s plan and when would you use the Boss’s plan? Why? 2. Freddy and Fannie Frugal has $10 to invest and is considering three different investment plans. Plan 1: Guarantees that the Frugals will earn $10.00 in interest every year. Plan 2: Guarantees that the Frugals will earn 10% interest compounded annually on the account. Plan 3: This plan has a lump sum payout at the day of withdraw that depends on the total time the investment is in the bank. The Frugals will receive the original $10 investment plus an interest payment equal to the number of years invested squared in. I. Utilizing technology create sketch of all three plans on the same set of axis. Indicate key intersection point(s) and the meaning of each. II .Making sense of the quantities and relationships that occur in the other three quadrants, answer the following problem situations. a. If the Frugals know that their anticipated twins (Mae and Mac) are going to arrive in the next 10 years, which plan would make the most money for the Frugals to renovate the nursery? What are the key characteristics of this plan? b. Rather than using the investment for nursery renovations, they elect to save for the twin’s college education. Which would be the best plan? Why? c. The Frugals then consider providing a retirement account for the twins. Which plan would be the most beneficial if the retirement age is 65? How do you know this? Standards are listed in alphabetical /numerical order not suggested teaching order. PLC’s must order the standards to form a reasonable unit for instructional purposes. Course Name: Middle School Math I Unit # 7 Unit Title: Functions and Their Graphs Part II CORE CONTENT Cluster Title: Write expressions in equivalent forms to solve problems Standard A.SSE.3a – b: Choose and produce an equivalent form of an expression to reveal and explain properties of the quantity represented by the expression. a. Factor a quadratic expression to reveal the zeros of the function it defines b. Complete the square in a quadratic expression to reveal the maximum or minimum values of the function it defines. Concepts and Skills to Master: Given a quadratic function explain the meaning of the zeros of the function. e.g. if f(x) = (x – c)(x – a), then f(a) = 0 and f(c) = 0 Given a quadratic expression, explain the meaning of the zeros graphically. e.g. for an expression (x – c)(x – a), a and c correspond to the x-intercepts (if a and c are real numbers). Write the vertex form of a quadratic expression by completing the square. Use the vertex form to find the maximum or minimum of a quadratic function and explain the meaning of the vertex SUPPORTS FOR TEACHERS Critical Background Knowledge Identifying and factoring perfect square trinomials Academic Vocabulary Completing the square, quadratic function, perfect square trinomials Suggested Instructional Strategies: Resources: Use algeblocks or algebratiles to explore the meaning of Textbook Correlation: 7-7, CC-15 “completing the square” and discover the algorithm NCDPI Unpacking A.SSE.3a – b: Students factor quadratic expressions and find the zeros of the quadratic function they represent. Zeroes are the x-values that yield a y-value of 0. Students should also explain the meaning of the zeros as they relate to the problem. For example, if the expression x2 – 4x + 3 represents the path of a ball that is thrown from one person to another, then the expression (x – 1)(x – 3) represents its equivalent factored form. The zeros of the function, (x –1)(x – 3) = y would be x = 1 and x = 3, because an x-value of 1 or 3 would cause the value of the function to equal 0. This also indicates the ball was thrown after 1 second of holding the ball, and caught by the other person 2 seconds later. At this level, limit to quadratic expressions of the form ax2 + bx + c. Students rewrite a quadratic expression in the form a = 1 (x − h)2 + k, with a = 1, to identify the vertex of the parabola (h, k), and explain its meaning in context. Standards are listed in alphabetical /numerical order not suggested teaching order. PLC’s must order the standards to form a reasonable unit for instructional purposes. Course Name: Middle School Math I Unit # 7 Sample Assessment Tasks Skill-based task 1. How are the following functions related? State the form of each equation. y1= (x– 3)(x + 1) y2= x2– 2x– 3 y3= (x– 1)2– 4 Determine the vertex, y-intercept, and x-intercept(s) for each function. Describe which form is each point most easily determined. Unit Title: Functions and Their Graphs Part II Problem Task 1. The expression 3m2 – 15m is the income gathered by promoters of a rock concert based on the ticket price, m. For what value(s) of m would the promoters break even? 2. The profit that a company makes selling an item (in thousands of dollars) depends on the price of the item (in dollars). If p is the price of the item, then three equivalent forms for the profit are: Standard form: −2p2 + 24p − 54 Factored form: −2(p − 3)(p − 9) Vertex form: −2(p − 6)2 + 18. Which form is most useful for finding a. The prices that give a profit of zero dollars? b. The profit when the price is zero? c. The price that gives the maximum profit? Standards are listed in alphabetical /numerical order not suggested teaching order. PLC’s must order the standards to form a reasonable unit for instructional purposes.

