Advanced Algebra Probability of Compound Events
advertisement
Advanced Algebra
Probability of Compound Events & Independence
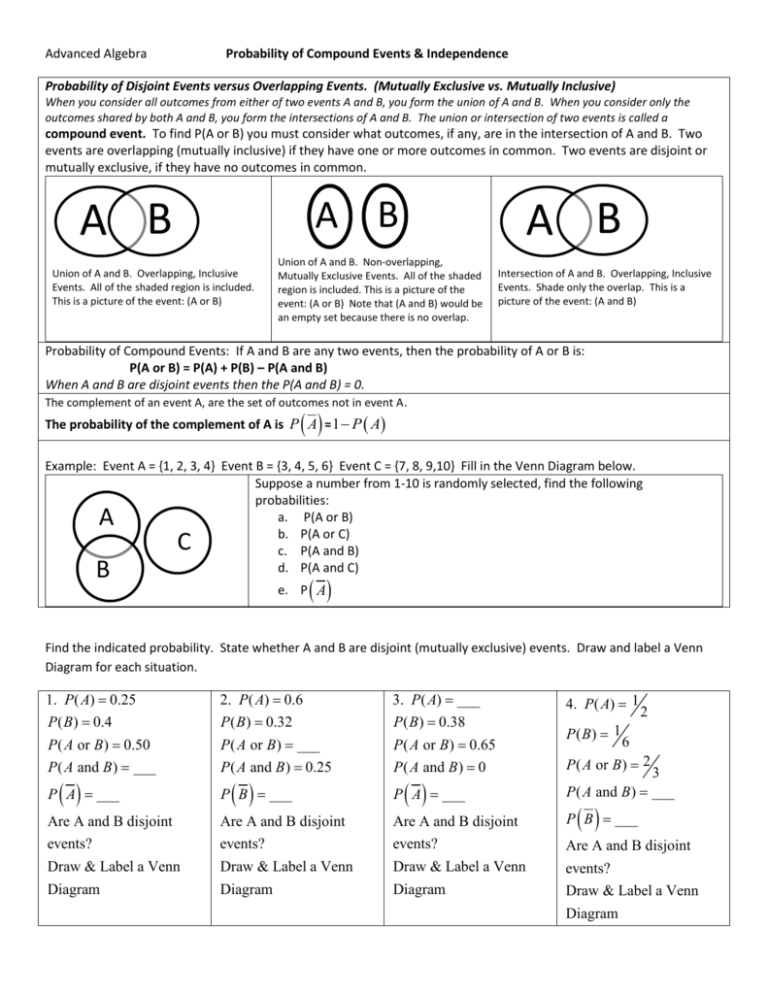
Probability of Disjoint Events versus Overlapping Events. (Mutually Exclusive vs. Mutually Inclusive)
When you consider all outcomes from either of two events A and B, you form the union of A and B. When you consider only the
outcomes shared by both A and B, you form the intersections of A and B. The union or intersection of two events is called a
compound event. To find P(A or B) you must consider what outcomes, if any, are in the intersection of A and B. Two
events are overlapping (mutually inclusive) if they have one or more outcomes in common. Two events are disjoint or
mutually exclusive, if they have no outcomes in common.
A B
A B
Union of A and B. Overlapping, Inclusive
Events. All of the shaded region is included.
This is a picture of the event: (A or B)
A B
Union of A and B. Non-overlapping,
Mutually Exclusive Events. All of the shaded
region is included. This is a picture of the
event: (A or B) Note that (A and B) would be
an empty set because there is no overlap.
Intersection of A and B. Overlapping, Inclusive
Events. Shade only the overlap. This is a
picture of the event: (A and B)
Probability of Compound Events: If A and B are any two events, then the probability of A or B is:
P(A or B) = P(A) + P(B) – P(A and B)
When A and B are disjoint events then the P(A and B) = 0.
The complement of an event A, are the set of outcomes not in event A .
The probability of the complement of A is P A = 1 P A
Example: Event A = {1, 2, 3, 4} Event B = {3, 4, 5, 6} Event C = {7, 8, 9,10} Fill in the Venn Diagram below.
Suppose a number from 1-10 is randomly selected, find the following
probabilities:
a. P(A or B)
b. P(A or C)
c. P(A and B)
d. P(A and C)
A
C
B
e. P A
Find the indicated probability. State whether A and B are disjoint (mutually exclusive) events. Draw and label a Venn
Diagram for each situation.
1. P ( A) 0.25
2. P ( A) 0.6
3. P ( A) ___
P ( B ) 0.4
P ( B ) 0.32
P ( B ) 0.38
P ( A or B ) 0.50
P ( A or B ) ___
P ( A or B ) 0.65
P ( A and B ) ___
P ( A and B ) 0.25
P ( A and B ) 0
P A ___
P B ___
P A ___
3
P ( A and B ) ___
Are A and B disjoint
Are A and B disjoint
Are A and B disjoint
P B ___
events?
events?
events?
Are A and B disjoint
Draw & Label a Venn
Draw & Label a Venn
Draw & Label a Venn
events?
Diagram
Diagram
Diagram
Draw & Label a Venn
4. P ( A) 1
P( B) 1
2
6
P ( A or B ) 2
Diagram
Two events are independent if the occurrence of one has no effect on the occurrence of the other. For instance, if a coin is tossed
twice, the outcome of the first toss (heads or tails) has no effect on the outcome of the second toss.
Probability of Independent Events: If A and B are independent events, then the probability that both A and B occur is
P(A and B) = P(A) • P(B)
More generally, the probability that n independent events occur is the product of the n probabilities of the individual events.
Two events A and B are dependent events if the occurrence of one affects the occurrence of the other. The probability that B will
occur given that A has occurred is called the conditional probability of B given A and is written as P(B|A).
Probability of Dependent Events: If A and B are dependent events, then the probability that both A and B occur is :
P(A and B) = P(A) • P(B|A)
Other Helpful Versions of This Formula
P( B | A)
P( A and B)
P( A)
or P( A | B)
P( A and B)
P( B)
Note: When A and B are independent events then the P(B|A) is the same as P(B). In otherwords, if the occurrence of A has no effect
on the occurrence of B, then the probability of B given A would be the same as the probability of B.
EXAMPLE: You randomly select two cards from a standard deck of 52 cards. What is the probability that the first card is not a heart
and the second card is a heart
(Let A = the first card and B = the second card. )
If you replace the first card before selecting the second?
If you do NOT replace the first card?
In this case A and B are independent events
In this case A and B are dependent events
P( A and B) P( A) P( B)
39 13 3
0.188
52 52 16
P( A and B) P( A) P( B | A)
39 13 13
0.191
52 51 68
YOU TRY IT: Find the probability of drawing the given cards from a standard deck of 52 cards (i) with replacement and
(ii) without replacement.
A.
(i)
A club, then a spade.
B. A king, then a queen, then a jack
(i)
(ii)
(ii)
More You Try It: Find the indicated probability. Determine if A and B are Independent or Dependent Events – Explain.
a. P ( A) 0.4
P( B) 0.6
P( B | A) 0.6
P( A and B) ___
d . P ( A) 0.7
P( B) 0.2
P( B | A) 0.5
P( A and B) ___
b. P( A) 0.3
P( B) 0.4
P( A | B) 0.3
P( A and B) ___
c. P( A) 0.3
P( B) 0.4
P( B | A) 0.6
P( A and B) ___
e. P ( A) ___
f . P ( A) 0.2
P ( B ) 0.8
P ( A | B ) 0.75
P( B) ___
P( A | B ) 0.2
P ( B | A) 0.8
P( B | A) 0.5
P ( A and B ) 0.6
P( A and B ) 0.1
The complement of at least one is none. Recall, the probability of the complement of A is P A = 1 P A
Thus the P(at least one) = 1 ̶ P(none)
EXAMPLE: While you are riding to school, your portable CD player randomly plays 4 different songs from a CD with 16 songs on it.
What is the probability that you will hear your favorite song on the CD at least once during the week (5 days)?
First, find the probability of not hearing your favorite song. This will be the number of ways to not hear your favorite song divided
by the number of ways to hear any 4 songs. P(not hearing song) =
C4
16 C4
15
Second, you need to realize that hearing or not hearing your favorite song on Monday, on Tuesday, and so on are INDEPENDENT
C
events. So the probability of never hearing your song for five days is P(not hearing song in 5 days) = 15 4
16 C4
5
Last, recall that the probability of at least one is equal to (1 – P(none)). That means the probability of hearing your song at least
5
C
once is P (hearing song at least once)=1 [ P (not hearing song for 5 days)] 1 15 4 0.763
16 C4
5
__________________________________________________________________________________________________________
YOU TRY IT: Angela usually rushes to make it to the bus stop in time to catch the school bus, and will often miss the bus
if it is early. The bus comes early to Angela’s stop 28% of the time. What is the probability that the bus will come early
at least once during a 5 day school week? (This is not a tree diagram situation, find example for at least one)
EXAMPLE: Using observations made of drivers arriving at a certain high school, a study reports that 69% of adults wear seat belts while driving. A
high school student also in the car wears a seat belt 66% of the time when the adult wears a seat belt, and 26% of the time when the adult does
not wear a seat belt. What is the probability that a high school student in the study wears a seat belt?
A probability tree diagram, where the probabilities are given along the branches, can help you solve the problem. Notice the probabilities for all
branches from the same point must sum to 1.
A:
C: Student wears seat belt
Adult
wears
seat beat
D: Student does not wear
seat belt
B:
Adult
does
not
wear
seat
belt
C: Student wears seat belt
D: Student does not wear
seat belt
So the probability that a high school student wears a seat belt is : P(C) = P(A and C) + P(B and C) = P(A) ·P(C|A) + P(B) ·P(C|B) =
(0.69)(0.66)+(0.31)(0.26) =0.536
A..YOU TRY IT: A high school basketball team leads at halftime in 60% of the games in a season. The team wins 80% of
the time when they have the halftime lead, but only 10% of the time when they do not. What is the probability that that
the team wins a particular game during the season? (Make a Probability Tree Diagram)
B..YOU TRY IT: It is estimated that 5.9% of Americans have diabetes. Suppose a medical lab uses a test for diabetes that
is 98% accurate for people who have the disease and 95% accurate for people who do not have it. Find the conditional
probability that a randomly selected person actually has diabetes given that the lab test says they have it. (make a
Probability Tree Diagram)
Classwork Blockday 5/2-3 2013 Complete the following problems. Refer to your notes and examples for help.
1.
Suppose 8% of Americans have disease A. Suppose a
medical test for this disease is 97% accurate for people who
have the disease and 90% accurate for people who do not
have it. Find the conditional probability that a randomly
selected person actually has the disease given that the
medical test says they have it. (make a Probability Tree
Diagram)
2. A teacher is holding tryouts for the school play. There are 15
students trying out for 7 parts in the play. Each student can play
each part. In how many ways can the teacher select the
students?
3. A youth indoor soccer team has 6 starting players. The
starting players must consist of 3 boys and 3 girls. There are 7
boys and 6 girls on the team. Each player can play each position.
In how many ways can the coach select players to start the
game?
5..Of the 120 students honored at an academic banquet, 40%
won awards for mathematics and 55% for English. Fourteen of
these students won awards for both mathematics and English.
One of the 120 students is chosen at random to be interviewed
for a newspaper article. What is the probability that the student
won an award in mathematics or English? (Venn Diagram this)
4.. A pet store has 18 light green parakeets (5 females and 13
males) and 25 sky blue parakeets ( 15 females and 10 males)
You randomly choose one of the parakeets. What is the
probability that it is a male or a sky blue parakeet?
7.. Suppose 4% of Americans have disease A. Suppose a medical
test for this disease is 94% accurate for people who have the
disease and 97% accurate for people who do not have it. Find
the conditional probability that a randomly selected person
actually has the disease given that the medical test says they
have it. (make a Probability Tree Diagram)
8. Find the probability of drawing the given cards from a
standard deck of 52 cards (a) with replacement and (b) without
replacement
i. A club, then a diamond
ii.. A jack, then a 7
iii.. A king, then another king, then a third king.
6.. The organizer of a potluck dinner sends 6 people a list of 10
different recipes and asks each person to bring one of the items
on the list. If all 6 people randomly choose a recipe from the list,
what is the probability at least 2 will bring the same thing?
Find the indicated probability and state whether A and B are disjoint events. Draw a Venn Diagram.
9. P( A) 0.23
P( B) 0.36
P( A or B) 0.59
P( A and B) ___
P A ___
10. P( A) 5
P( B) 1
11. P( A) 6
8
12. P( A) 17%
13
P( B) 35%
P( A or B) 52%
P ( B ) ___
4
2
P( A and B) ___
P ( A or B ) 11
13
P ( A and B ) 4
13
P A ___
P A ___
P( A or B) 1
P( A and B) ___
P A ___
EVENTS A and B are independent. Find the indicated Probability
13. P ( A) ___
P ( B ) 0.3
P ( A and B ) 0.3
P A ___
14. P( A) 5
8
P( B) 4
5
P( A and B) ___
P A ___
15. P ( A) 0.9
P ( B ) ___
P ( A and B) 0.54
P A ___
Determine if events A and B are independent or dependent. Show the work to justify your decision.
16. P ( A) 0.6
P( B) 0.4
P( B | A) 0.4
P( A and B) ___
17. P ( A) ___
P ( B ) .75
P ( B | A) 0.6
P ( A | B ) 0.2
P ( A and B ) 0.15
18. P( A) 0.3
P ( B ) 0.8
P ( B | A) ___
P ( A and B ) 0.27

