Chapter 11 SPSS Instructions
advertisement
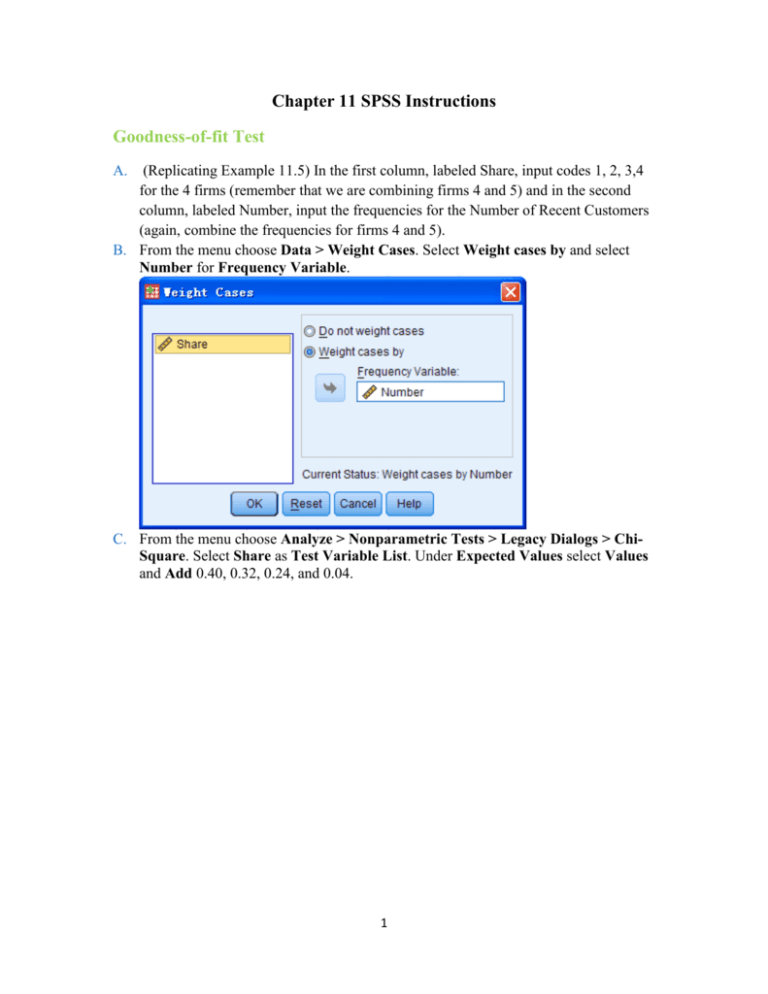
Chapter 11 SPSS Instructions Goodness-of-fit Test A. (Replicating Example 11.5) In the first column, labeled Share, input codes 1, 2, 3,4 for the 4 firms (remember that we are combining firms 4 and 5) and in the second column, labeled Number, input the frequencies for the Number of Recent Customers (again, combine the frequencies for firms 4 and 5). B. From the menu choose Data > Weight Cases. Select Weight cases by and select Number for Frequency Variable. C. From the menu choose Analyze > Nonparametric Tests > Legacy Dialogs > ChiSquare. Select Share as Test Variable List. Under Expected Values select Values and Add 0.40, 0.32, 0.24, and 0.04. 1 D. SPSS reports the following results. The value of the test statistic (in boldface) matches the one obtained in Example 11.5. In addition, SPSS reports the exact pvalue of 0.017. Share Observed N Expected N Residual 1.00 70 80.0 -10.0 2.00 60 64.0 -4.0 3.00 54 48.0 6.0 4.00 16 8.0 8.0 Total 200 Test Statistics Share Chi-square df 10.250a 3 2 Asymp. Sig. .017 a. 0 cells (.0%) have expected frequencies less than 5. The minimum expected cell frequency is 8.0. Test of Independence A. (Replicating Example 11.6) Label two columns ‘Gender’ and ‘Type’. The first 50 rows are designated as Female for Gender and Economy for Type, the next 60 rows are designated as Female for Gender and Noneconomy for Type, the next 120 rows have Male for Gender and Economy for Type, and the final 170 rows have Male for Gender and Noneconomy for Type. B. From the menu choose Analyze > Descriptive Statistics > Crosstabs. Select Gender for Row(s) and Type for Column(s). Choose Statistics and select Chi-Square. Click Statistics, check Chi-square. Click cell, check Expected. Click OK. C. SPSS reports the following results. The expected frequency for each cell is shown below the observed frequency. In addition, SPSS shows each cell’s chi-square 3 contributions below the expected frequency. The value of the test statistic (in boldface) almost matches the one obtained in Example 11.6 – the values differ due to rounding. In addition, SPSS reports the exact p-value of 0.462. Gender * Type Crosstabulation Type Economy Gender Female Male Count Total 50 60 110 Expected Count 46.8 63.3 110.0 Count 120 170 290 123.3 166.8 290.0 170 230 400 170.0 230.0 400.0 Expected Count Total Noneconomy Count Expected Count Chi-Square Tests Value Pearson Chi-Square Continuity df Asymp. Sig. (2- Exact Sig. (2- Exact Sig. (1- sided) sided) sided) .542a 1 .462 .388 1 .533 .540 1 .462 Correctionb Likelihood Ratio Fisher's Exact Test N of Valid Cases .497 400 a. 0 cells (.0%) have expected count less than 5. The minimum expected count is 46.75. b. Computed only for a 2x2 table 4 .266

