Figure S6. - BioMed Central
advertisement
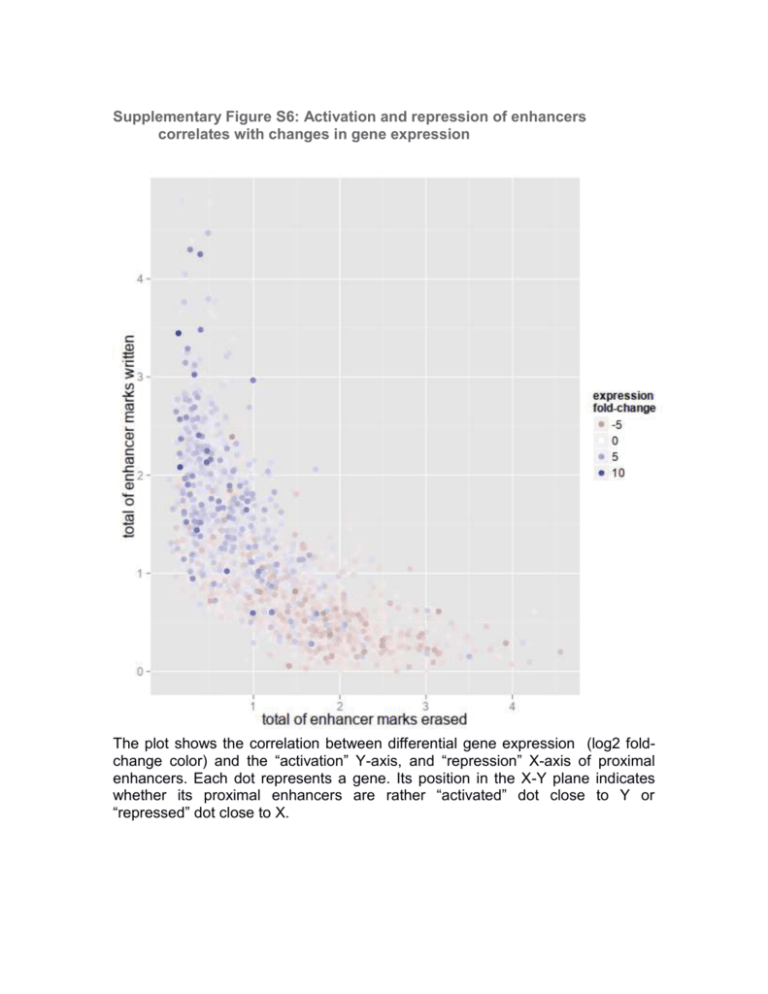
Supplementary Figure S6: Activation and repression of enhancers correlates with changes in gene expression The plot shows the correlation between differential gene expression (log2 foldchange color) and the “activation” Y-axis, and “repression” X-axis of proximal enhancers. Each dot represents a gene. Its position in the X-Y plane indicates whether its proximal enhancers are rather “activated” dot close to Y or “repressed” dot close to X.
